The power price scenario EU Outlook 2050, released by Energy Brainpool, provides a forecast of the development of the European average power prices. In there, the analysts show tendencies in supply and demand, give an outlook on sales values, sales volumes and sales revenues of fluctuating renewable energies.
The European electricity markets are constantly changing. Revised existing regulations and new laws, e.g. the Electricity Market Act in Germany, affect numerous business and political decisions in the energy sector. The EU Energy Outlook 2050 provides average values of a potential scenario for EU-28* countries. The actual developments in the individual countries vary strongly in some cases. For sound market assessments, solid modeling of the individual national markets and their influencing factors, including sensitivity analyses, is indispensable.
1. Supply side: Installed generating capacities in EU-28*
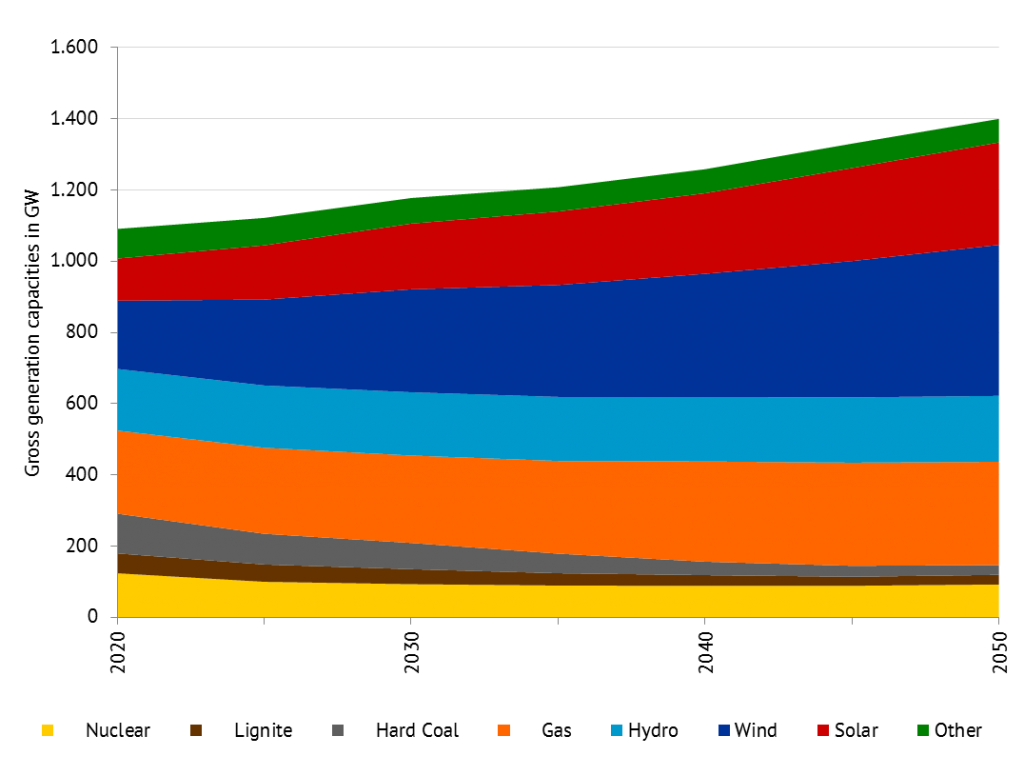
Figure 1: Gross generation capacities in GW, source: Energy Brainpool
Prospectively, the European supply side will primarily be dominated by fluctuating renewable energies – in particular by wind, photovoltaic and hydropower. Wind energy is expected to expand for an estimated 30 % of the overall generation capacities by 2050. With regards to controllable fossil capacities, primarily natural gas power plants are planned to be built in Europe. The capacities of nuclear energy and coal-fired power plants will fall to 10 % of the total installed capacities by 2050. All in all, the conventional controllable generation capacities will decline from 50 % to 30 %. Therefore the fluctuating feed-in will dominate and lead to more volatile prices.
2. Demand side: coverage of the demand by energy sources in EU-28*
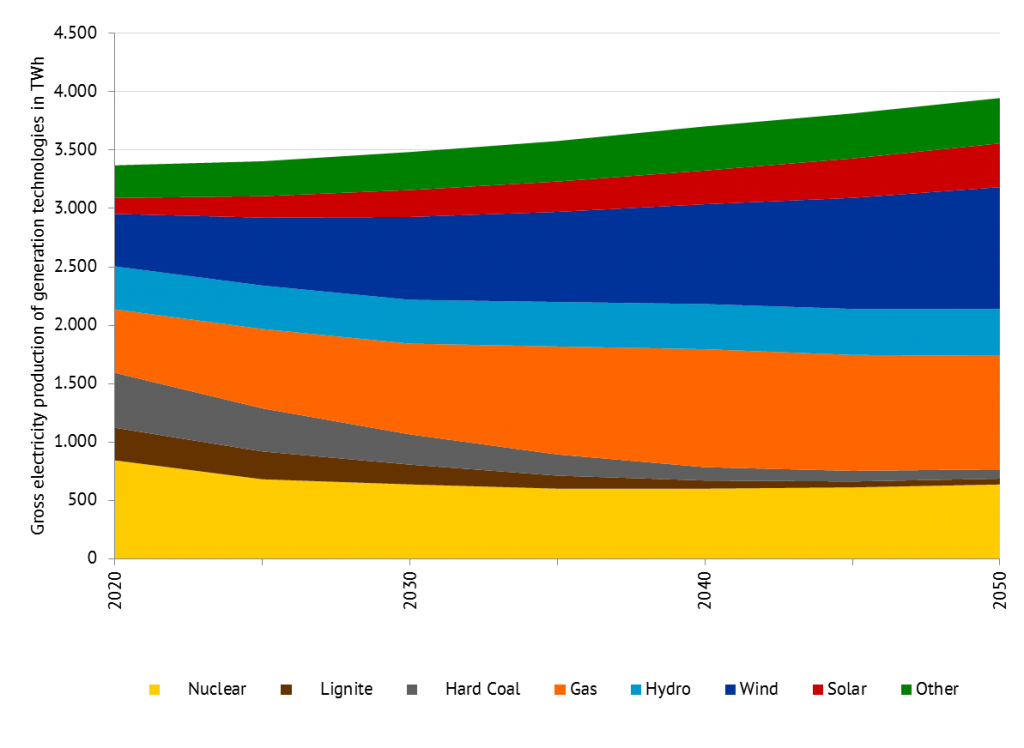
Figure 2: Gross electricity production of generation technologies in TWh, source: Energy Brainpool
The gross electricity generation covering the demand will increase by 18 % till 2050 as a result of higher demand by cause of proceeding electrification of the heat and transport sectors. While the production from coal-fired power plants will significantly decline the production of natural gas will double. In 2050, fluctuating renewable energies will generate 36 % of electricity while over 44 % will be produced by controllable conventional power plants. The remaining electricity production will be generated by controllable renewable energy technologies such as biomass power plants.
3. Commodity price development
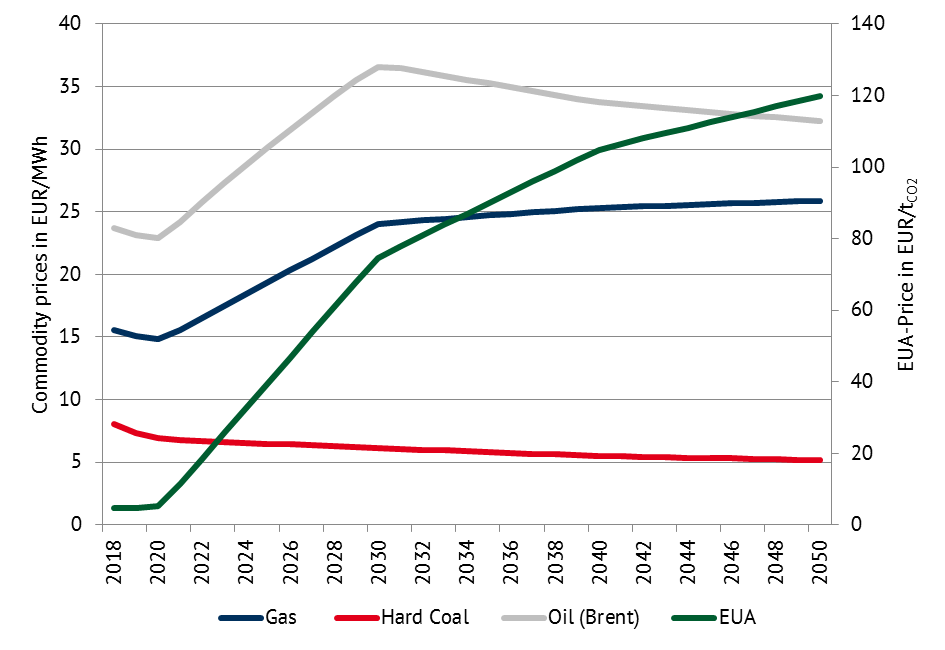
Figure 3: Commodity prices (real: EUR 2015), source: Energy Brainpool
The price trend in the run up to 2020 will align with the future markets price trends. The expected price trend between 2020 to 2050 is based on the 450ppm scenario of the IEA’s World Energy Outlook. The scenario refers to the 2° Celsius target. This will primarily be achieved by a sharp increase of EUA prices. Through the decreasing demand for fossil fuels caused by high prices for CO2-certificates prices for natural gas, oil and hard coal will remain at a relatively constant level.
4. Simulated annual power prices EU 28*
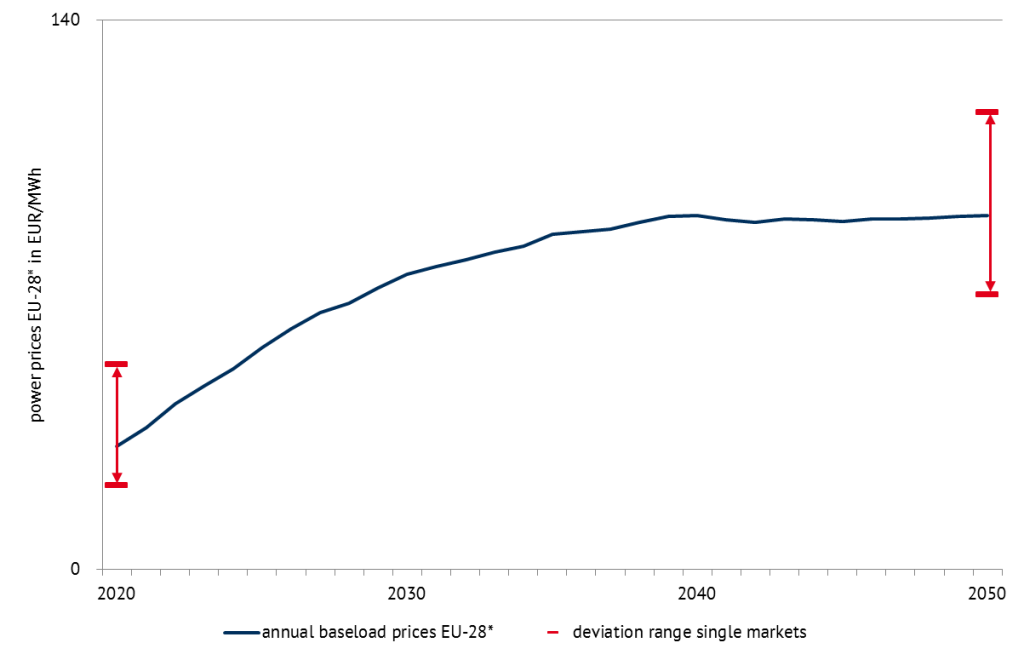
Figure 4: Power prices (real: EUR 2015) and deviation range in national EU-28* markets, source: Energy Brainpool
The price trends until 2020 will be characterized by low prices for primary energy carriers on the future markets. The development of electricity prices from 2020 to 2030 will comply with the increasing primary energy and CO2-certificate prices. From 2040 onwards electricity prices are expected to decline despite rising prices for primary energy carriers and CO2. The reason for that is the high feed-in of wind and solar power plants increasing the periods of low and even negative electricity prices. The actual developments in the individual countries vary strongly in some cases. For sound market assessments, solid modeling of the individual national markets and their influencing factors, including sensitivity analyzes, is indispensable.
5. Average sales values and sales volumes for wind in EU-28*
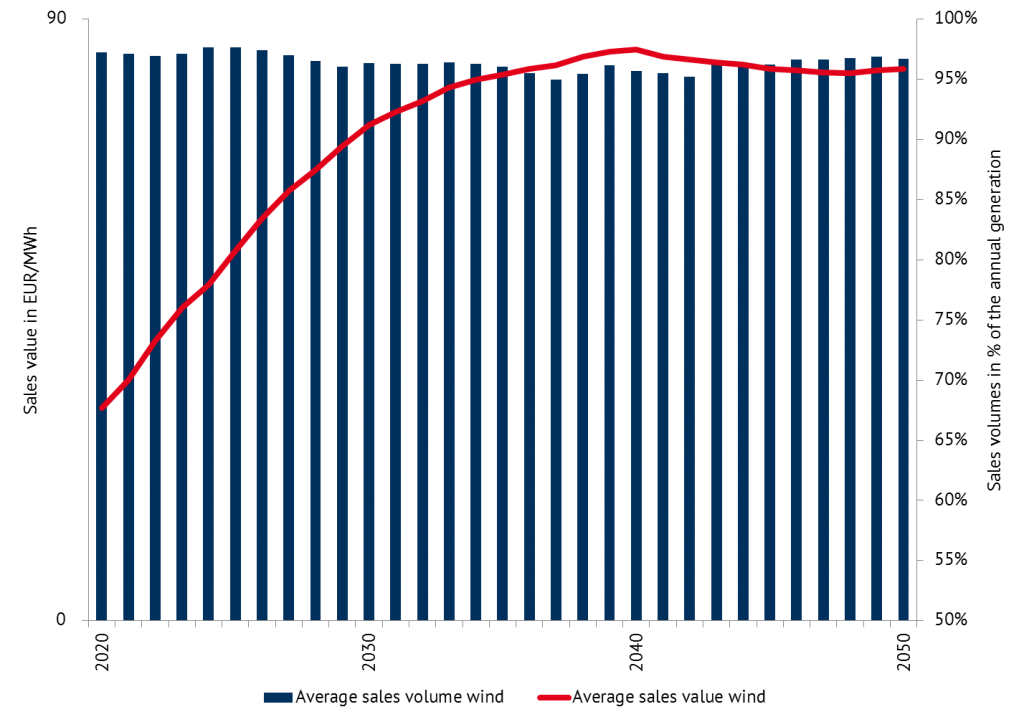
Figure 5: Sales values (real: EUR 2015) and volumes wind EU-28*, source: Energy Brainpool
The market value is the average weighted price for electricity which wind power plants can realize on the spot market. In this regard only hours with positive prices are taken into account. The sales value of wind energy will rise till 2040 and thereafter remain at a high level despite increasing installed capacities and simultaneous cannibalisation effects. The sales volumes will only decrease slightly. The few hours with extreme electricity prices avail wind power plants which generate positive revenues producing in these hours.
Energy Brainpool defines, amongst others, the index “sales value” in the white paper “valuation of electricity market revenues of fluctuating renewable energy sources”. It is more convenient for calculating realistic revenues of renewable energy sources on the electricity market compared to previous indices.
6. Average sales values and sales volumes for solar in EU-28*
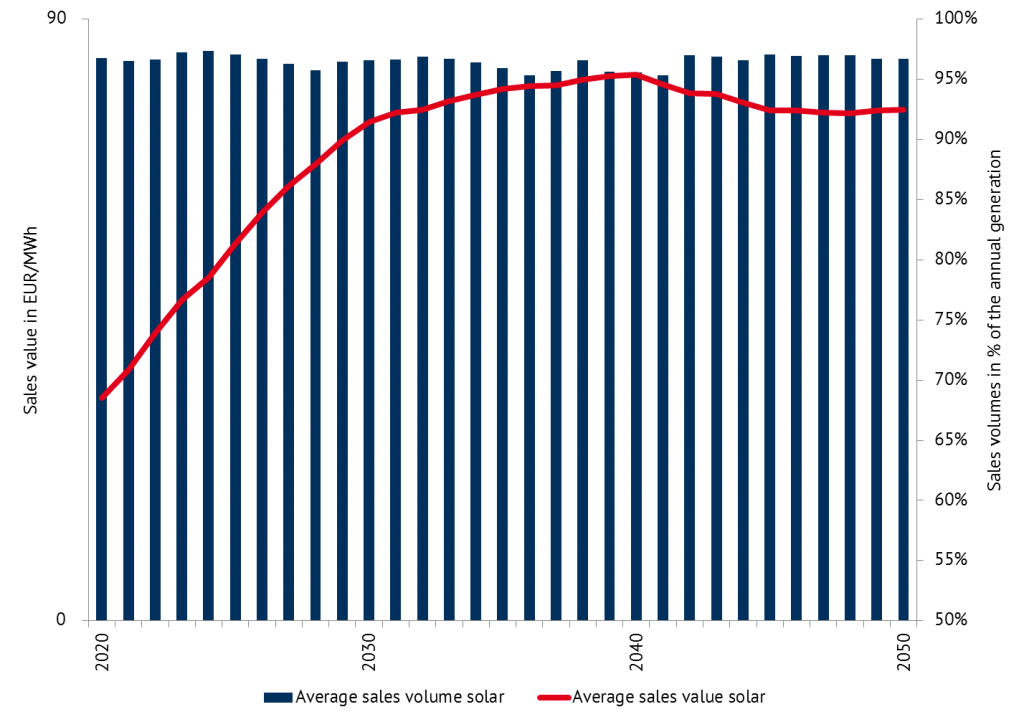
Figure 6: Sales value (real: EUR 2015) and volumes solar in EU-28*, source: Energy Brainpool
The sales value is the average weighted price for electricity which solar power plants can achieve on the spot market. Only hours with positive prices are taken into account. The sales value of solar energy will rise till 2040 and remain at a high level thereafter, however still below the level of wind energy. This is caused by the strong simultaneousness of solar energy. Hence the electricity price declines in times of high solar feed-in and causes lower sales values. The sales volumes on EU average will only decrease slightly. However, in some countries the decline is much steeper.
7. Average sales revenues wind and solar EU-28*
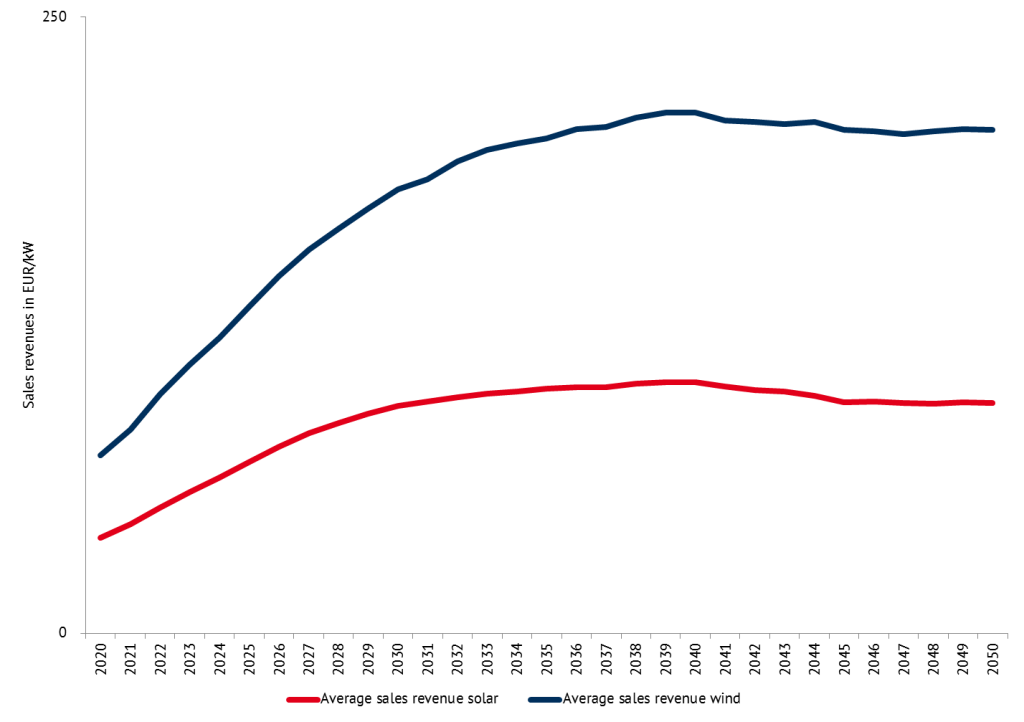
Figure 7: Sales revenues (real: EUR 2015) wind and solar in EU-28*, source: Energy Brainpool
In contrast to the sales value, the sales revenue refers to the installed capacity. The index “sales revenue” shows what a technology (wind or solar) can earn without additional payments on the power market (energy-only market) yearly per kilowatt. The parameter refers to the project-specific average full load hours as well as sales values and volumes.
The comparison of wind and solar power plants’ sales revenues show that the revenues of solar energy are lower with regards to the installed capacity in EUR/kW. This is due to lower full load hours by contrast with wind energy. A generally higher level of wholesale prices for power in the years from 2025 onwards will lead to higher sales revenues for renewable energies.
8. Extreme prices EU-28*
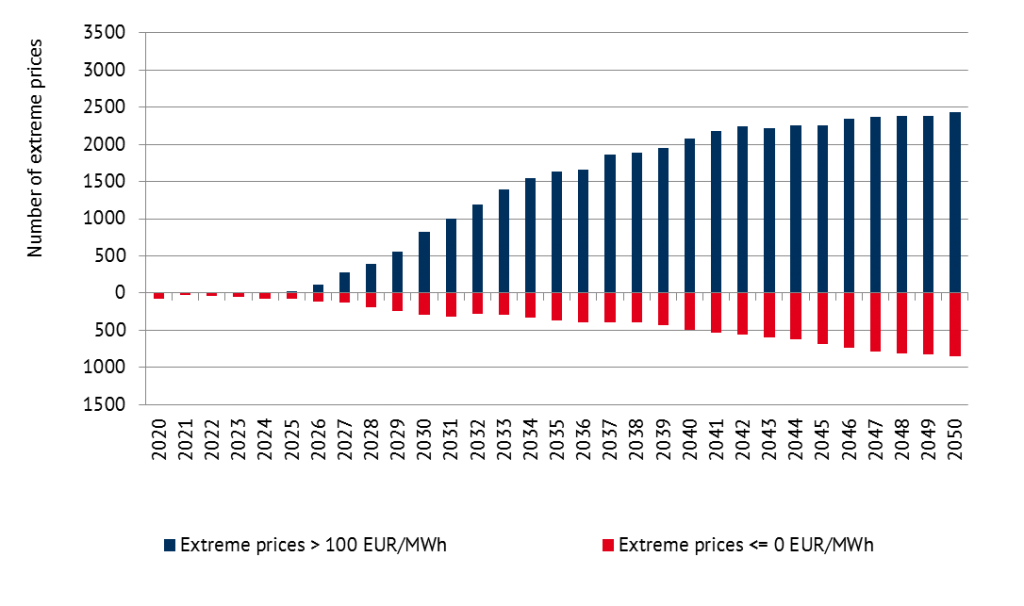
Figure 8: Number of extreme prices, source: Energy Brainpool
Due to the high share of fluctuating generation capacities electricity prices will become more volatile. Moreover, extremely high and extremely low prices will occur. Extreme prices are electricity prices equal to/below 0 EUR/MWh and those above 100 EUR/MWh. The anticipated ratio between the two extremes will create new opportunities for market newcomers and new technologies, e.g. storage systems. Severe extreme prices can be anticipated in Europe from 2026 onwards.
9. E-mobility in the EU-28*
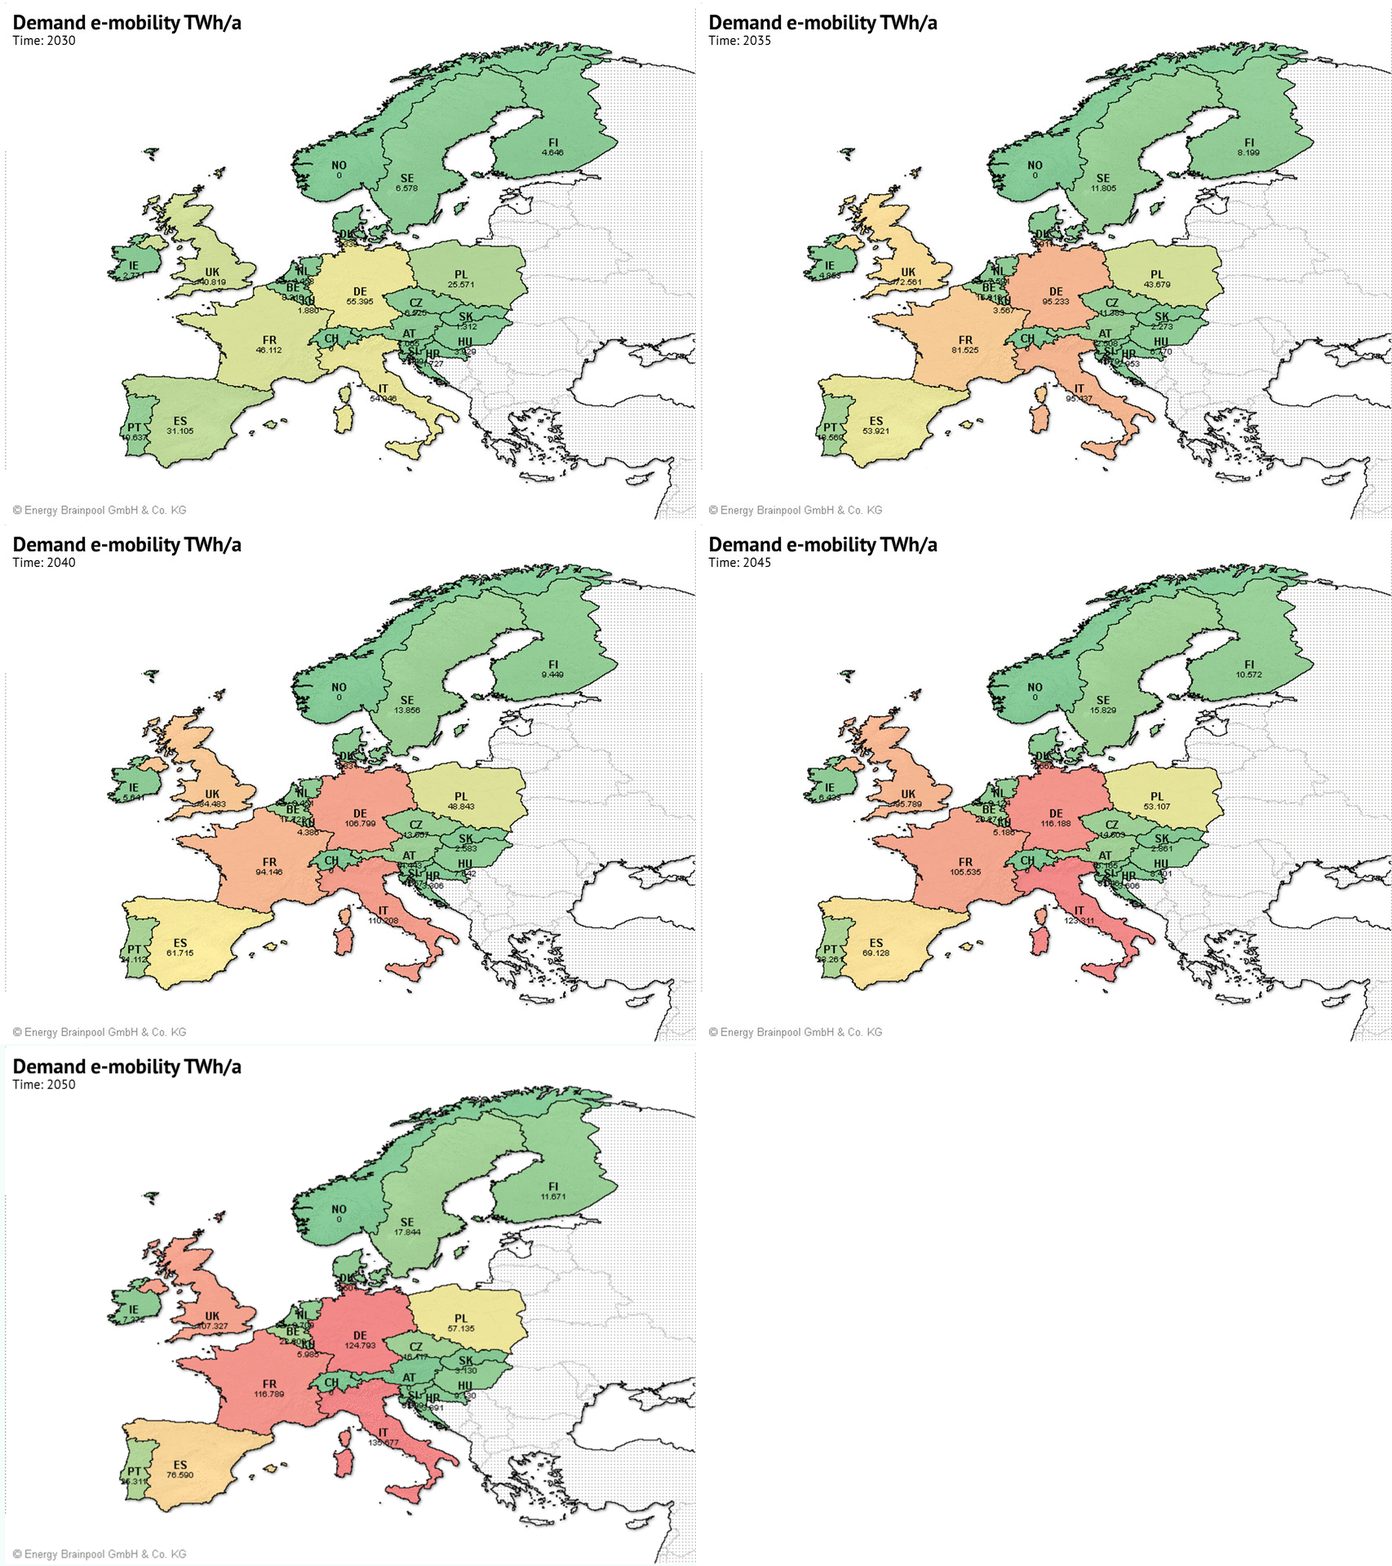
Figure 9: Demand of e-mobility in EU-28*, source: Energy Brainpool
The future development of e-mobility is a decisive factor for the European and national targets in terms of the greenhouse gas emissions reduction. If the decarbonisation of the transport sector will genuinely be implemented through e-mobility technologies the electricity demand will drastically increase. With a share of 100% e-mobility in the private transport sector in the EU28 countries by 2050, this will result in an additional electricity demand of around 830 TWh/a. The development of e-mobility was not taken into account in the results presented.
* EU-28 including Norway and Switzerland


