


Hardly any other market in Germany has undergone as rapid a change in recent years as the market for battery storage. Within ten years, battery storage systems with a total of 6.5 GW power and 10.1 GWh energy have been installed.
The possible applications are manifold:
- peak shaving (capping of peak loads),
- use for uninterruptible power supply for industrial customers,
- use as a buffer,
- increasing the self-supply rate in the household sector.
For the coming years, a further 1.1 GW of power and 1.4 GWh of energy have been announced in the large-scale storage sector alone..[1] The stationary battery market can be divided into three areas: Home storage systems (HSS, up to 30 kWh energy), industrial storage (ISS, up to 1 MWh energy) and large-scale storage batteries (LSS, greater than 1 MWh energy).
Storage and photovoltaic systems – a good combination
Of these, home storage systems are the largest and fastest growing market with 5.1 GW of power and 8.4 GWh energy. Most storage units in the household sector are installed in combination with photovoltaic systems. In this segment, the battery market has benefitted greatly from the popularity of photovoltaic technology.
With a penetration rate of over 98 %, the lithium-ion battery (LI) is the most widely used. Lead-acid, redox-flow and saltwater batteries are also used. However, their share of less than 2 % is negligible. Around 56 % of HSS systems are in the 5 to 10 kWh segment, while the segment larger than 10 kWh is also significant with 37 % of systems. The energy-to-performance ratio (EPR), i.e. the time it takes a storage unit to fully discharge at maximum power, is on average two hours for HSS.
The role of the large-scale storage market
The large-scale storage systems market is the second largest market for stationary battery systems with 1.2 GW power and 1.3 GWh energy. In the past, there was a wider range of technologies here than in the other markets. By now, the LI battery dominates this market as well, with lead-acid batteries seeing some use as well.
The possible uses for LSS include ancillary and grid services, as well as the integration of renewable energies, industrial self-sufficiency and arbitrage trading. With a market share of 77 %, most LSS can store an energy amount of less than 10 MWh. Another 18 % of LSS can provide 10 to 20 MWh energy; and only a few systems are larger than that. The EPR varies between 30 minutes and 4 hours depending on the use of the battery storage system.
Industrial storage is bringing up the rear
The market for industrial storage systems is the smallest in comparison. Here, 0.2 GW of power and 0.4 GWh of energy are installed. In addition to 1 % redox flow and 3 % lead-acid batteries, LI batteries have a market share of 95 %. Most of these storage systems are used to integrate renewable energy sources and to charge an electric vehicle fleet. 86 % of the systems can store between 30 to 100 kWh energy. Another 8 % are 100 to 200 kWh in size, with the remaining systems being even larger. The EPR for most of the systems is between two and three hours.
Historical revenues of battery storage on the FCR market
The revenue potential of large-scale storage systems depends on the type of marketing. The most important ways to generate revenue are currently the provision of frequency containment reserve (FCR) and arbitrage trading on the spot market. In the future, the automatic frequency restoration reserve (aFRR) will also become relevant as a source of revenue.
On the FCR market, around 570 MW of capacity is tendered daily in 4-hour blocks, with the purpose of stabilising the frequency of the grid in the event of fluctuations. The suppliers are determined via an auction on the day before. In order to be able to submit bids, potential suppliers must “pre-qualify”. At the beginning of 2023, the total pre-qualified capacity in Germany was just under 7 GW. Battery storage systems accounted for 630 MW of this, with an upward trend. [2]
The price on the FCR market fluctuates significantly. Assuming the average annual price and an availability of 90%, a battery storage system with 1 MW power and 1 MWh energy could generate revenues of around €136,000 in 2021 and €180,000 in 2022. In the first nine months of 2023, the potential revenue amounted to €70,000.
Historical revenue potential of battery storage on the spot market
Another way to earn money with LSS is trading on the various spot markets for power at the EPEX Spot in Paris. The day-ahead market allows participants to trade power for delivery on the following day. It is organised as an auction for hourly deliveries, ending every day at noon. The subsequent evaluation of the bids and offers provides information about the market price on the following day.
The intraday market, on the other hand, offers a platform for trading power for delivery on the current day. It consists of both auctions and continuous trading. The frequency of the traded products ranges from hourly to quarter-hourly deliveries.
The marketing strategy for an LSS on the spot market aims for revenue maximisation, taking into account efficiency losses and avoiding storage operations with suboptimal revenue generation. The individual sub-markets are considered sequentially, starting with the day-ahead market.
The analysts at Energy Brainpool have developed an optimisation model for this purpose. It calculates the revenues achievable with optimal trading behaviour – either with historical market prices or for the future. In the latter case, we must make assumptions about the development of future power prices, for example by means of a fundamental power market model. But how does the model work?
Optimisation model
In each modelling interval, the model inherits the state-of-charge (SOC) from the previous interval as well as the trading positions from the upstream submarket. In addition, an expectation regarding the price level in the next interval allows the storage level to be assessed at the end of the current interval. The intervals are one day with 24 hours/96 quarter hours in the day-ahead auction and intraday auction submarkets, respectively.
When modelling the intraday auction, the model takes into account the 24 positions from the trades concluded on the day-ahead market. In each of the 96 quarter hours, the previously planned storage behaviour can either be selected again in a cost-neutral manner, or the revenue can be increased by adapting the storage behaviour and corresponding trading transactions.
This “re-optimisation” repeats itself every hour on the continuous ID market, since the price level is only known immediately before the delivery period. The ID3 prices of EPEX Spot are used for modelling. The storage system optimises its charging and delivery behaviour based on the prices of the following three hours, while only committing to the trading position of the first hour. Furthermore, an additional restriction limits the charging behaviour in this hour: After every three hours, the planned charging level according to the intraday auction must be maintained.
Results
Figure 1 shows the potential annual revenues for a large storage facility with 1 MW power and 1 MWh storage energy on the frequency containment reserve market and on the spot market in the period from the beginning of 2019 to the end of September 2023.
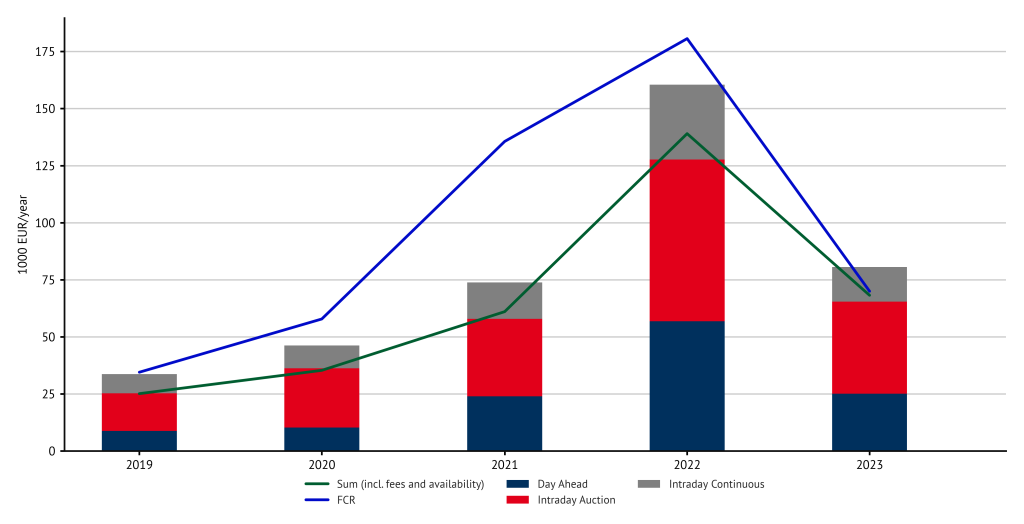
Figure 1: Annual revenues on the frequency containment reserve market and the spot market. For 2019, only data points from July are available for the FCR market. For 2023, the months up to and including September are considered.
It stands out that the revenues on the FCR market as well as on the spot market have increased over time, with a particularly strong increase in 2022. This is due to the price determination on the spot market through the so-called “merit order” and the strong increase in prices for fossil fuels in the last two years. As a result, the power prices in the hours when thermal power plants such as coal or gas were “price-setting” tended to be higher than in previous years. In the hours when renewables set the power price, prices are close to zero or even negative, regardless of fuel prices. As a result, high price spreads within one day occurred in 2022, from which a battery storage system could benefit.
In addition, Figure 1 shows that in recent years, LSS operators have been able to generate higher revenues on the FCR market than on the spot market, although the difference has decreased over the last two years. In the first nine months of 2023, the potential revenues on both markets were at almost the same level. In relative terms, the FCR market has lost profitability. This can be explained by an increasing number of suppliers, especially in the form of battery storage, facing an almost constant demand.
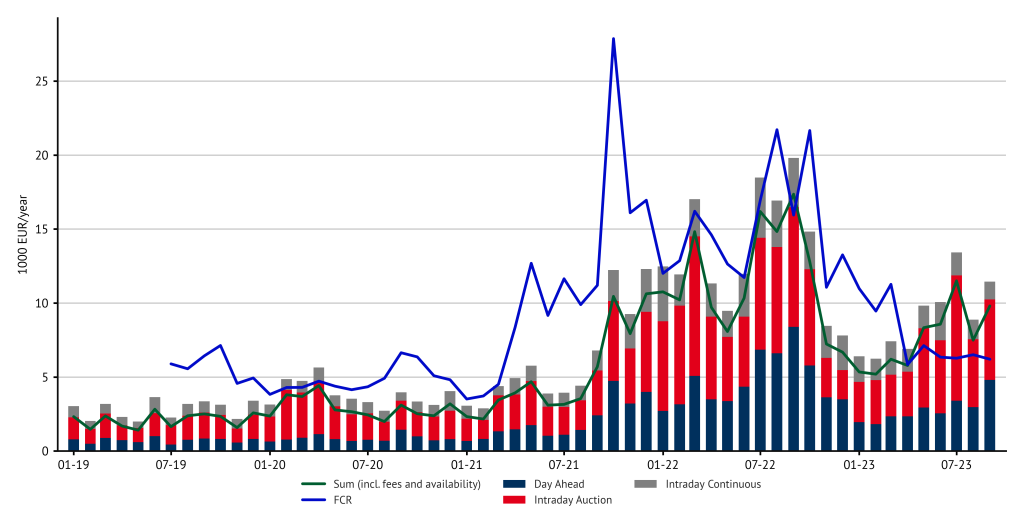
Figure 2: Monthly revenues on the frequency containment reserve market and the spot market. For 2019, only data from July is available for the FCR market.
Figure 2 shows the possible monthly revenues for a large-scale storage system with 1 MW power and 1 MWh energy. The revenues on the spot market were already slightly above the level of 2019 in 2020 and 2021, before increasing considerably in the second half of 2021.
While in 2020 and 2021 the revenues were mostly between €3,000 and €6,000 per month, in 2022 they reached values of well over €15,000 in four months. From November 2022 onwards, the revenues dropped significantly, but showed an upward trend again starting in May 2023. This illustrates again the significant impact of fossil fuel prices is on the daily spreads and thus on the revenues of battery storage systems. A comparison between the markets shows that in some months in 2022 and especially in 2023, higher revenues could be achieved on the spot markets than on the FCR market.
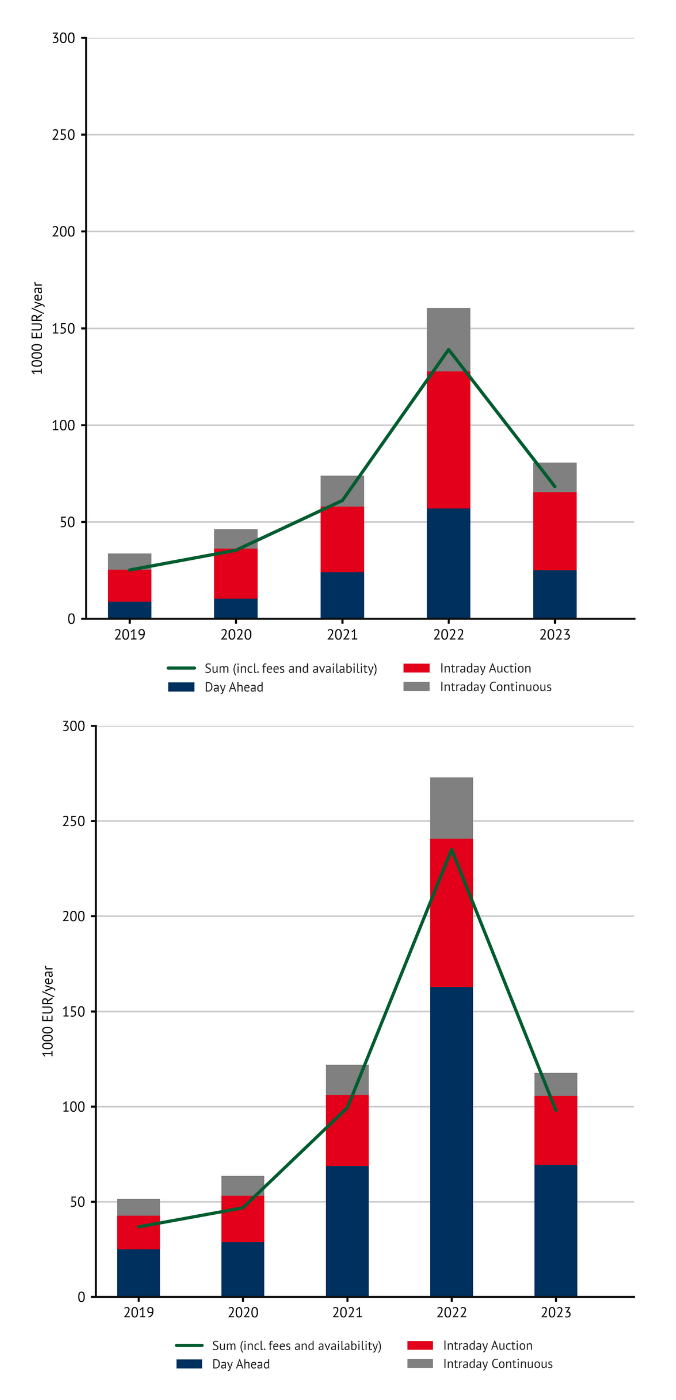
Comparison of the previous battery system with a battery storage system with the same power and higher energy capacity. For 2023, the months up to and including September are considered.
Figure 3 compares the previous battery storage system with a battery storage system with the same power and a higher energy capacity of 4 MWh. As the energy increases, revenues also increase, but not proportionally. Holding the battery power constant, a greater energy capacity means more time for the battery to discharge. This makes it possible to provide power over a longer period of time and creates potential for higher revenues.
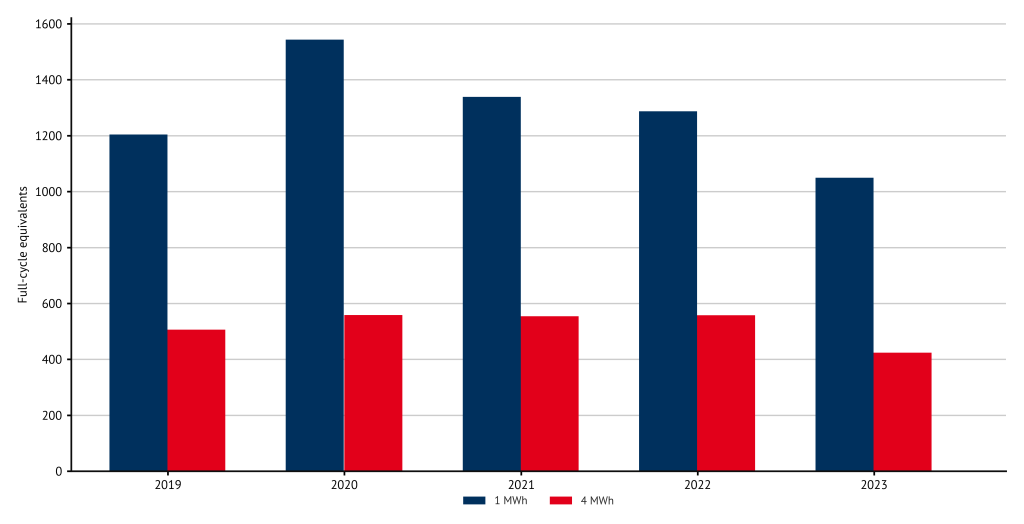
Figure 4: Full cycle equivalents for two battery storage systems with different energy capacities. For 2023, the months up to and including September are taken into account.
In addition to the revenue potential, other parameters are relevant for an investment decision, in particular the number of charge cycles that an LSS goes through, which influences the service life and thus also the costs of the storage system. One indicator here is the so-called “full cycle equivalents”, i.e. the number of complete charging and discharging cycles that the storage system goes through in a certain period of time.
Figure 4 illustrates the full cycle equivalents when the LSS is optimised to achieve the highest revenue. It shows that the system with the larger energy capacity only goes through 30 to 40 % of the cycles that the smaller system requires.
A larger system therefore generates higher potential revenues with a smaller number of full cycle equivalents and thus a longer lifetime. On the other hand, with a higher energy capacity, the investment and operating costs also increase. In order to choose the “optimal” size for a storage system, the potential revenues can be compared to the system-specific costs for different LSS.
Conclusion
The number of large-scale battery storage system connected to the grid in Germany has increased significantly in recent years and will continue to grow in the coming years. In addition to marketing on the FCR market, which has been the most important business model so far, increasing spreads on the day-ahead market and the intraday market lead to a higher revenue potential for battery storage on the spot market.
In this article, we have looked at the development of the revenue potential on the individual markets in recent years. Of course, what is relevant for the decision to invest in a large-scale battery storage system today are the revenue expectations (a) in the coming years, i.e. over the expected lifetime of a new storage system, and (b) using a strategy of a combined marketing of the storage system on reserve and spot markets (“multi-market approach”).
By combining a fundamental modelling of the day-ahead market for the next 30 years and a multi-market optimisation model for storage revenues, Energy Brainpool can provide such a revenue assessment and thus support you in your investment decision.
In addition to the “stand-alone” storage systems discussed above, an analogous analysis is also possible for battery storage systems that are combined with a RE system (“co-location”). Furthermore, the optimisation model outlined above is also used to map the feed-in behaviour of battery storage systems in Energy Brainpool’s power price scenarios, thereby further improving the quality of the simulated power prices.
Learn more about battery storage systems in our live online training (German language): Batteriespeicher am Strommarkt on 22/11 and 23/11.
Authors: Elena Dahlem, Alex Schmitt
Quellen:
Jan Figgener, Christopher Hecht, David Haberschusz, Jakob Bors, Kai Gerd Spreuer, Kai-Philipp Kairies, Peter Stenzel, Dirk Uwe Sauer, The development of battery storage systems in Germany: A market review (status 2023), 2023, DOI: 10.48550/arXiv.2203.06762
[1] Sources for all numerical data in this section: www.battery-charts.de, Figgener et al. (2023)
[2] See https://www.regelleistung.net/xspproxy/api/staticfiles/regelleistung/pq-leistungindeutschland(stand01.01.2023).pdf
What do you say on this subject? Discuss with us!