


The topic of security of energy supply is currently on everyone’s mind. This is why the German and French governments, among others, have published new plans for the modernisation of their power plants in the coming decades. Climate change is also an important issue. The EU Green Deal defines the goal of climate neutrality in Europe by 2050 and focuses primarily on renewable energies.
In order to achieve the goals of modernisation and climate neutrality, the supply and consumption structure must be changed. This will pose challenges for energy-intensive sectors of the economy in particular. What consequences will these developments have for power prices, revenue potential and risks for photovoltaics and wind? In the current “EU Energy Outlook 2060”, we show long-term trends in Europe.
In the “EU Energy Outlook 2060”, Energy Brainpool presents how commodity prices, the addition of new power plants and the demand for electricity could develop. In addition, the analysts explore various paths for power prices and the energy market up to the year 2060 based on the interaction of these factors. The article explains and compares the developments in the “Central” and “GoHydrogen” power price scenarios: These scenarios are updated quarterly by the energy market experts. In detail, the model covers the 27 EU countries as well as Norway, Switzerland and the UK.
We show in our blog post the average values for all 30 countries. Nevertheless, the actual developments in the individual countries may differ significantly from this generalised trend. Therefore, it is highly recommended to consider the individual national markets with their specific influencing factors and to conduct sensitivity analyses for possible drastic changes. This is the only way to make well-founded decisions on how to trade on the energy market.
Energy Brainpool’s power price scenarios
Energy Brainpool currently offers a selection of four power price scenarios. Figure 1 shows the respective trends of the scenarios regarding power and gas prices. The scenarios differ significantly in their assumptions regarding the development of commodity prices, the power plant fleet and flexible electricity demand. This results in different price paths.
The source for the long-term commodity price assumptions in Energy Brainpool’s power price scenarios is the International Energy Agency’s World Energy Outlook 2023 with the three commodity price scenarios “Stated Policy”, “Announced Pledges” and “Net Zero Emissions”.
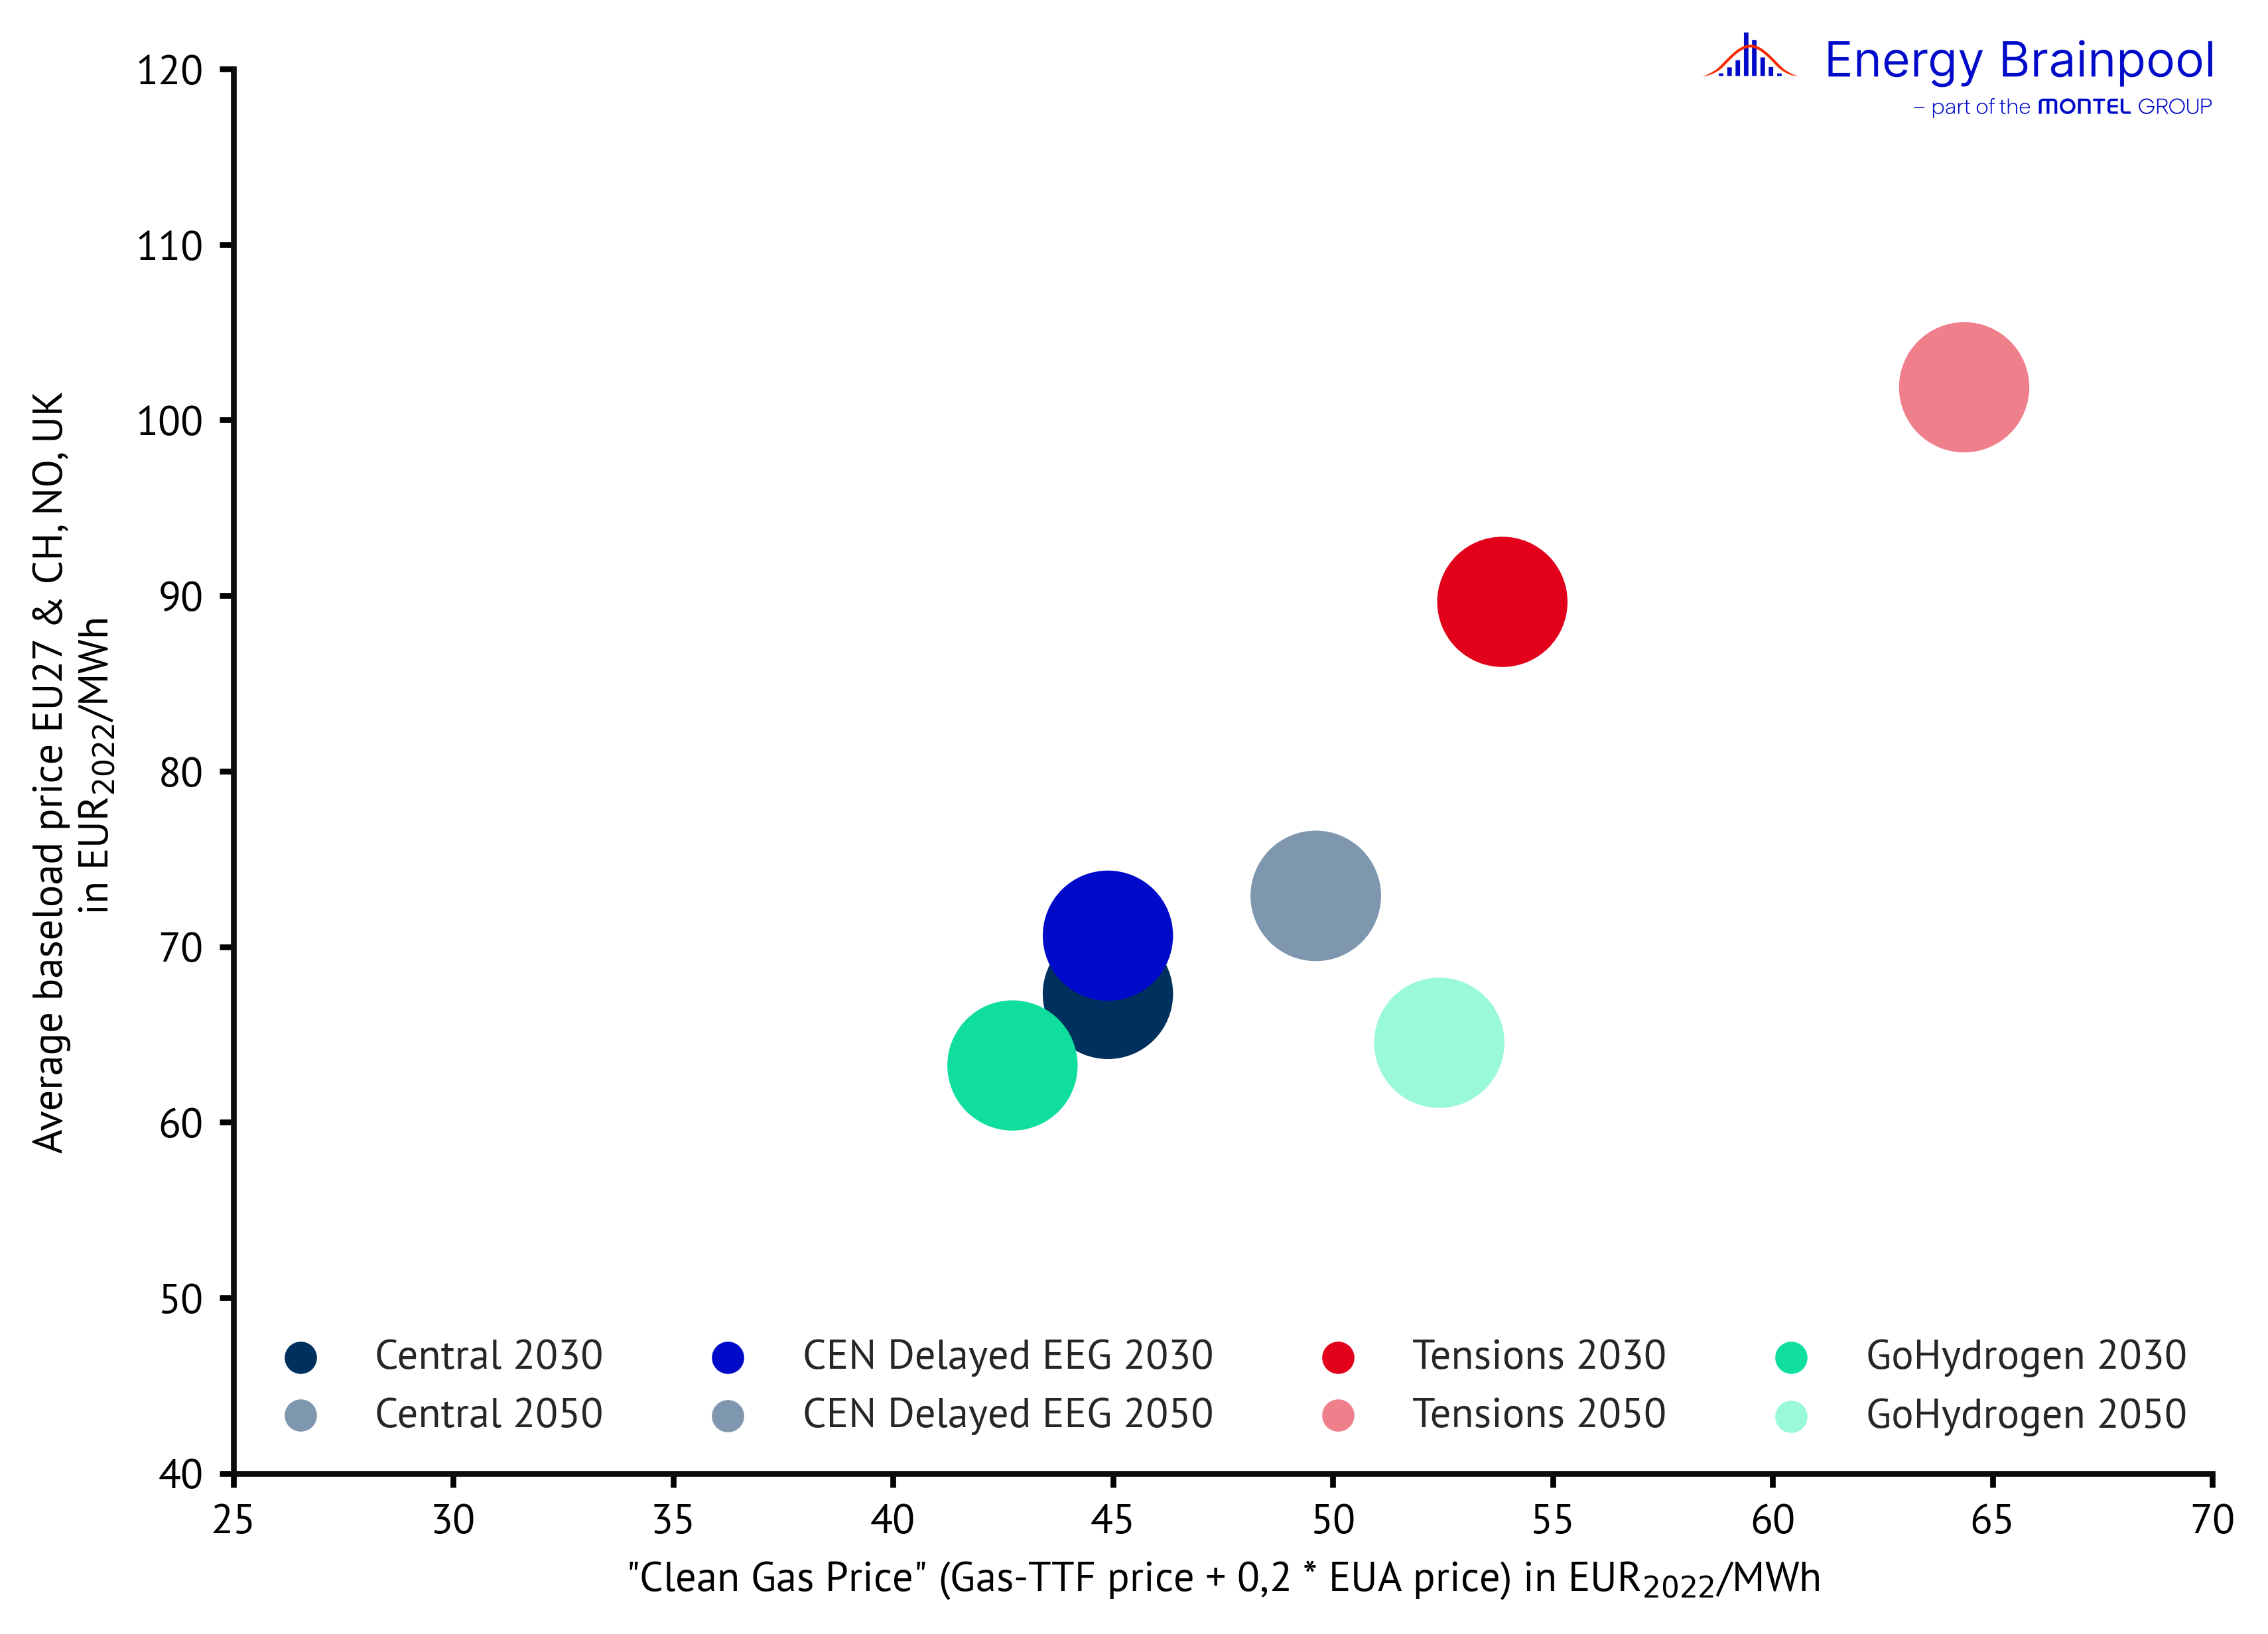
Figure 1: Trends in the different scenarios (Source: Energy Brainpool, 2024)
“Central” scenario
One of the key starting points for the “Central” scenario is that Europe will completely stop importing Russian pipeline gas by 2027 at the latest due to the current tensions with Russia. As a result, the global market price for LNG determines the trading price for natural gas. Fossil natural gas will become less relevant on the market in the long term. This is because it is increasingly being displaced by synthetic fuels and so-called “green” hydrogen. To the extent that natural gas is still used for power generation after 2040, its price will need to fall as the price of CO2 rises in order to remain competitive.
This scenario models a highly decentralised energy system in the future. As a result, the energy market experiences a significant expansion of renewables in order to reduce and ultimately end Europe’s dependence on imports of fossil fuels.
At the same time, an increase in flexible electricity demand can be observed. This is because both electrolysers that produce hydrogen and the heating sector, due to an increasing number of heat pumps, are recording high demand. In addition, the share of electric mobility in Europe for cars and trucks will increase to 95 % by 2060.
The “Central – Delayed EEG” sensitivity
Since the beginning of 2024, Energy Brainpool has been modelling a sensitivity in addition to the established “Central” scenario. This represents an energy system with a slower expansion of renewable energies. Since the war between Russia and Ukraine, general construction costs and capital costs (WACC) have risen enormously. At the same time, power prices have fallen significantly in 2023. This will result in lower revenues for renewable projects.
This results in a so-called missing-money-problem, which affects the financing of the energy transition and thus poses a challenge to the energy transition in general. The German government’s Climate and Transformation Fund (KTF) was intended to reduce this missing money problem among investors.
However, this plan collapsed due to the ruling of the Federal Constitutional Court on November 15, 2023. This is because the KTF funds are no longer available to the extent required. Energy Brainpool took this event as an opportunity to model a delayed expansion of renewable energies in the “Delayed EEG” sensitivity. The gaps to the “Central” scenario in the expansion statistics should be closed by 2050.
“Tensions” scenario
In the “Tensions” scenario, the central assumption is that the current tensions between Russia and the West will continue to characterise the coming years and will become more intense. Against this backdrop, Europe stops importing Russian pipeline gas as early as possible. The price of natural gas will then be based on the global market price for LNG. However, the demand for LNG is also very high in Asia, which is why there is strong competition. The price of natural gas will remain at a high level in the medium term.
At the same time, the CO2 prices in this scenario exceed those of the “Central” scenario. With these costs, if fossil fuels continue to be used, additional revenue is generated for the state finances to refinance national debt. These revenues also help promote technological development in the use of hydrogen.
Another crisis that is relevant to this scenario is the shortage of specialist workers. This can be seen in Germany, for example: The expansion of renewables is progressing more slowly than in the “Central” scenario. This is precisely due to the lack of specialist workers but also as a result of insufficient political support.
“GoHydrogen” scenario: a hydrogen energy world
For the first time ever, the EU Green Deal sets a target for the entire EU to achieve climate neutrality by 2050. Despite the clear objective, it remains unclear exactly what measures can be used to achieve this. With “GoHydrogen”, Energy Brainpool has developed a scenario that models a far-reaching transformation of the energy system leading to climate neutrality.
The “GoHydrogen” scenario presents a future energy supply for Europe in which fossil natural gas is replaced by hydrogen on a long-term basis. The potential of hydrogen to supply energy is used in a wide variety of sectors. Hydrogen will become one of the backbones of the energy system.
The areas of application for hydrogen are diverse: fuel cells, climate-neutral steel from the direct reduction process, hydrogen as a substance in the chemical industry and hydrogen-based heating systems for feeding energy into certain heating networks are just a few examples.
This wide range of applications results in a high demand for hydrogen, which will exceed 2,200 TWh calorific value by 2050. 50 % of this demand can be covered by domestic (European) hydrogen production (mainly by electrolysers).
In addition to the increasing use of hydrogen, many applications will also be electrified. This will be especially relevant for private transportation, the supply of heat for industrial processes and the heat supply of buildings. As a result, the total demand for electricity, including the electricity consumption of electrolysers that produce hydrogen in Europe, will increase significantly.
This will result in an annual Europe-wide electricity demand of over 5,700 TWh by 2050. This represents almost a doubling of today’s electricity consumption. In order to meet this demand, renewable energy plants such as onshore and offshore wind turbines and solar plants in particular, but also “H2-capable” gas turbines will produce large quantities of electricity.
However, hydrogen cannot only be produced locally, so value chains for importing hydrogen are also important. In terms of hydrogen imports, regions such as MENA, sub-Saharan Africa, Australia and South and North America offer great export potential.
The MENA countries in particular are in a key position due to their convertible natural gas pipelines and geographical proximity to Europe. As a result, many existing value chains would only have to be slightly restructured.
Further information on the “GoHydrogen” scenario can be found in our white paper dedicated to this topic, which you can download for free from our website.
The development of commodity prices in the various scenarios
Prices on the futures market form an important data basis for the pricing of fuels and CO2 in the coming years. Natural gas prices in particular have fallen significantly since 2022. However, they remain at a higher level than the long-term average.
Figure 2 shows the development of the futures price for natural gas (TTF) for the delivery year 2025. For the coming years, the futures market expects a continued decline in gas and hard coal prices, while CO2 prices (EUA and UKA) are expected to rise slightly.
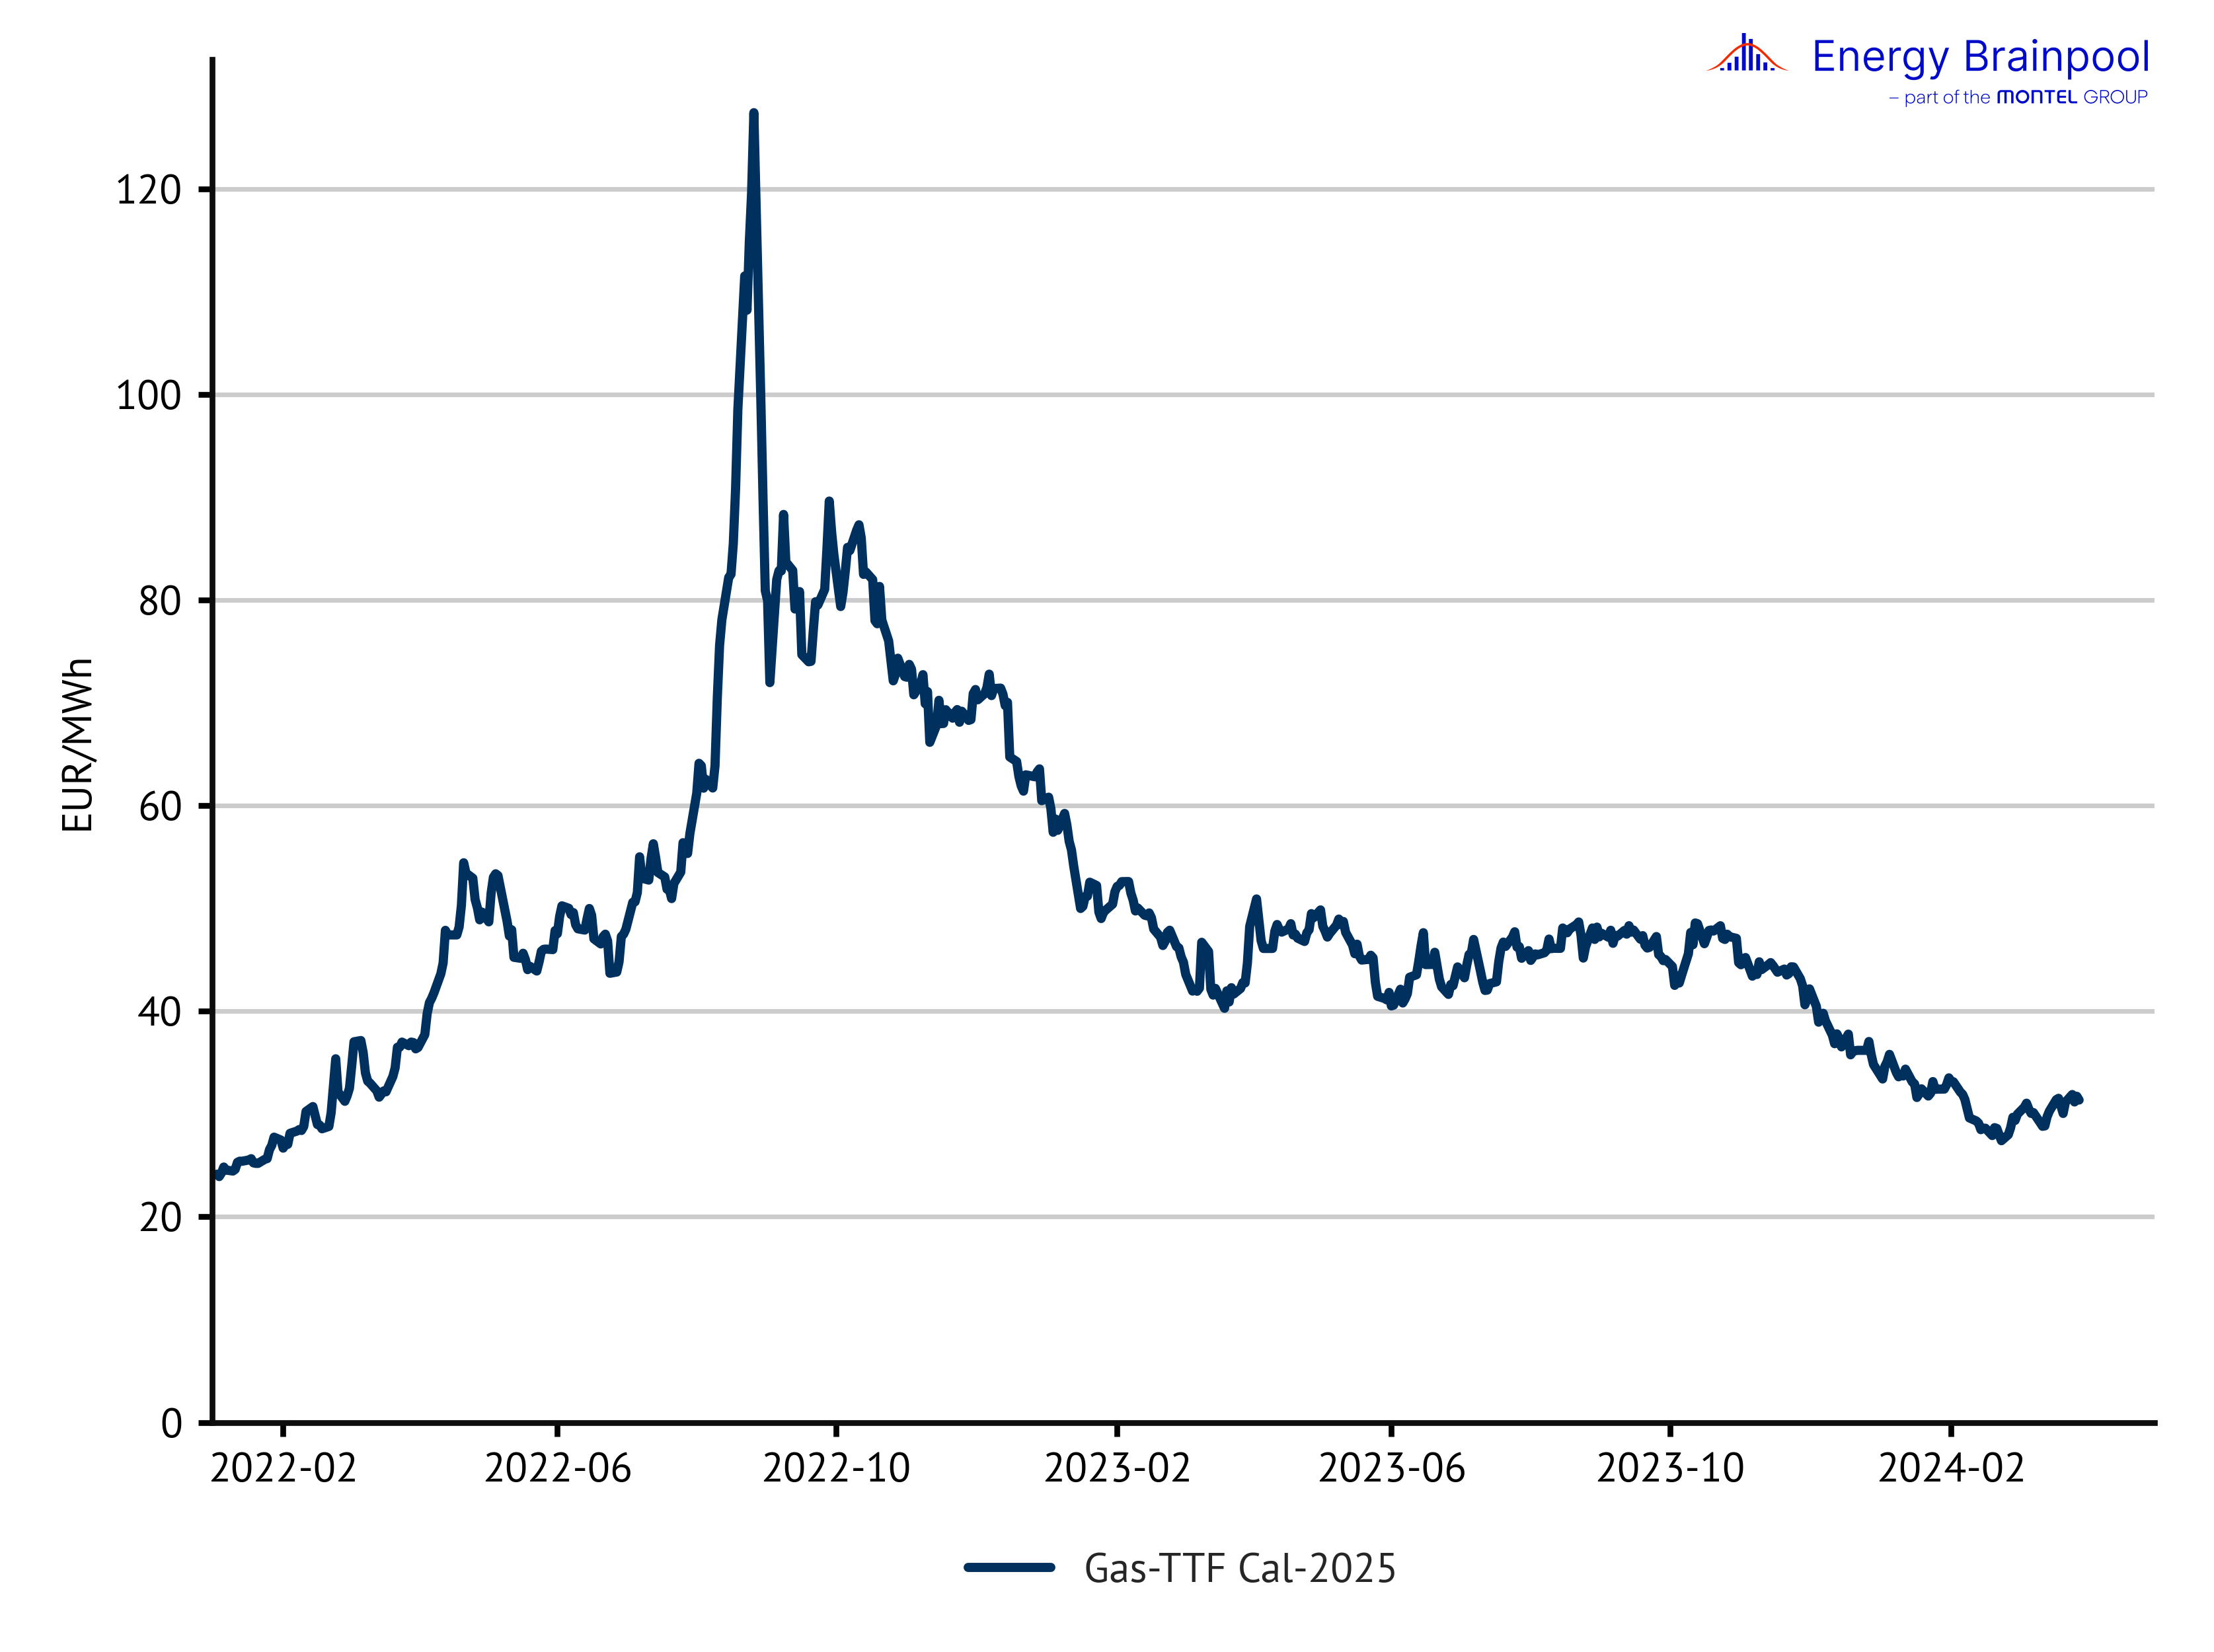
Figure 2: Future-prices gas TTF (Source: ICE, 2024)
In Energy Brainpool’s power price scenarios, the price of natural gas in Europe is modelled based on the global market price for LNG in the medium term. US LNG emerges as the most important import source for Europe, which is why it is assumed to set the price. On the market, the export price for US LNG historically corresponds to the benchmark price for natural gas at the US trading hub Henry Hub.
In addition, a surcharge for transportation within the USA and for the liquefaction of natural gas for transportation as LNG must be taken into account. In order to model the price of US LNG as an imported product in Europe, the costs for shipping and regasification in Europe must be included before the LNG can be used on the European market. Figure 3 shows the individual cost components based on the Henry Hub price forward curve and the average assumptions for the costs of liquefaction, freight and regasification.
Taking exchange rate and inflation assumptions into account, the natural gas price for the “Central” scenario is 22.30 EUR2022/MWh. This price is used in the scenario as an assumption for the year 2030. Compared to the IEA’s current World Energy Outlook 2023 (IEA, 2023) [2], it is around 3 EUR/MWh higher than the value assumed in the “Announced Pledges Scenario” (APS) for the natural gas price in Europe for 2030. In the APS, only the emission reductions to which governments have already committed themselves in the form of “Pledges” are realised.
The “Central” scenario is based on a comparable assumption, where the defined regulatory targets for the expansion of renewable energies and emission reductions are used as assumptions.
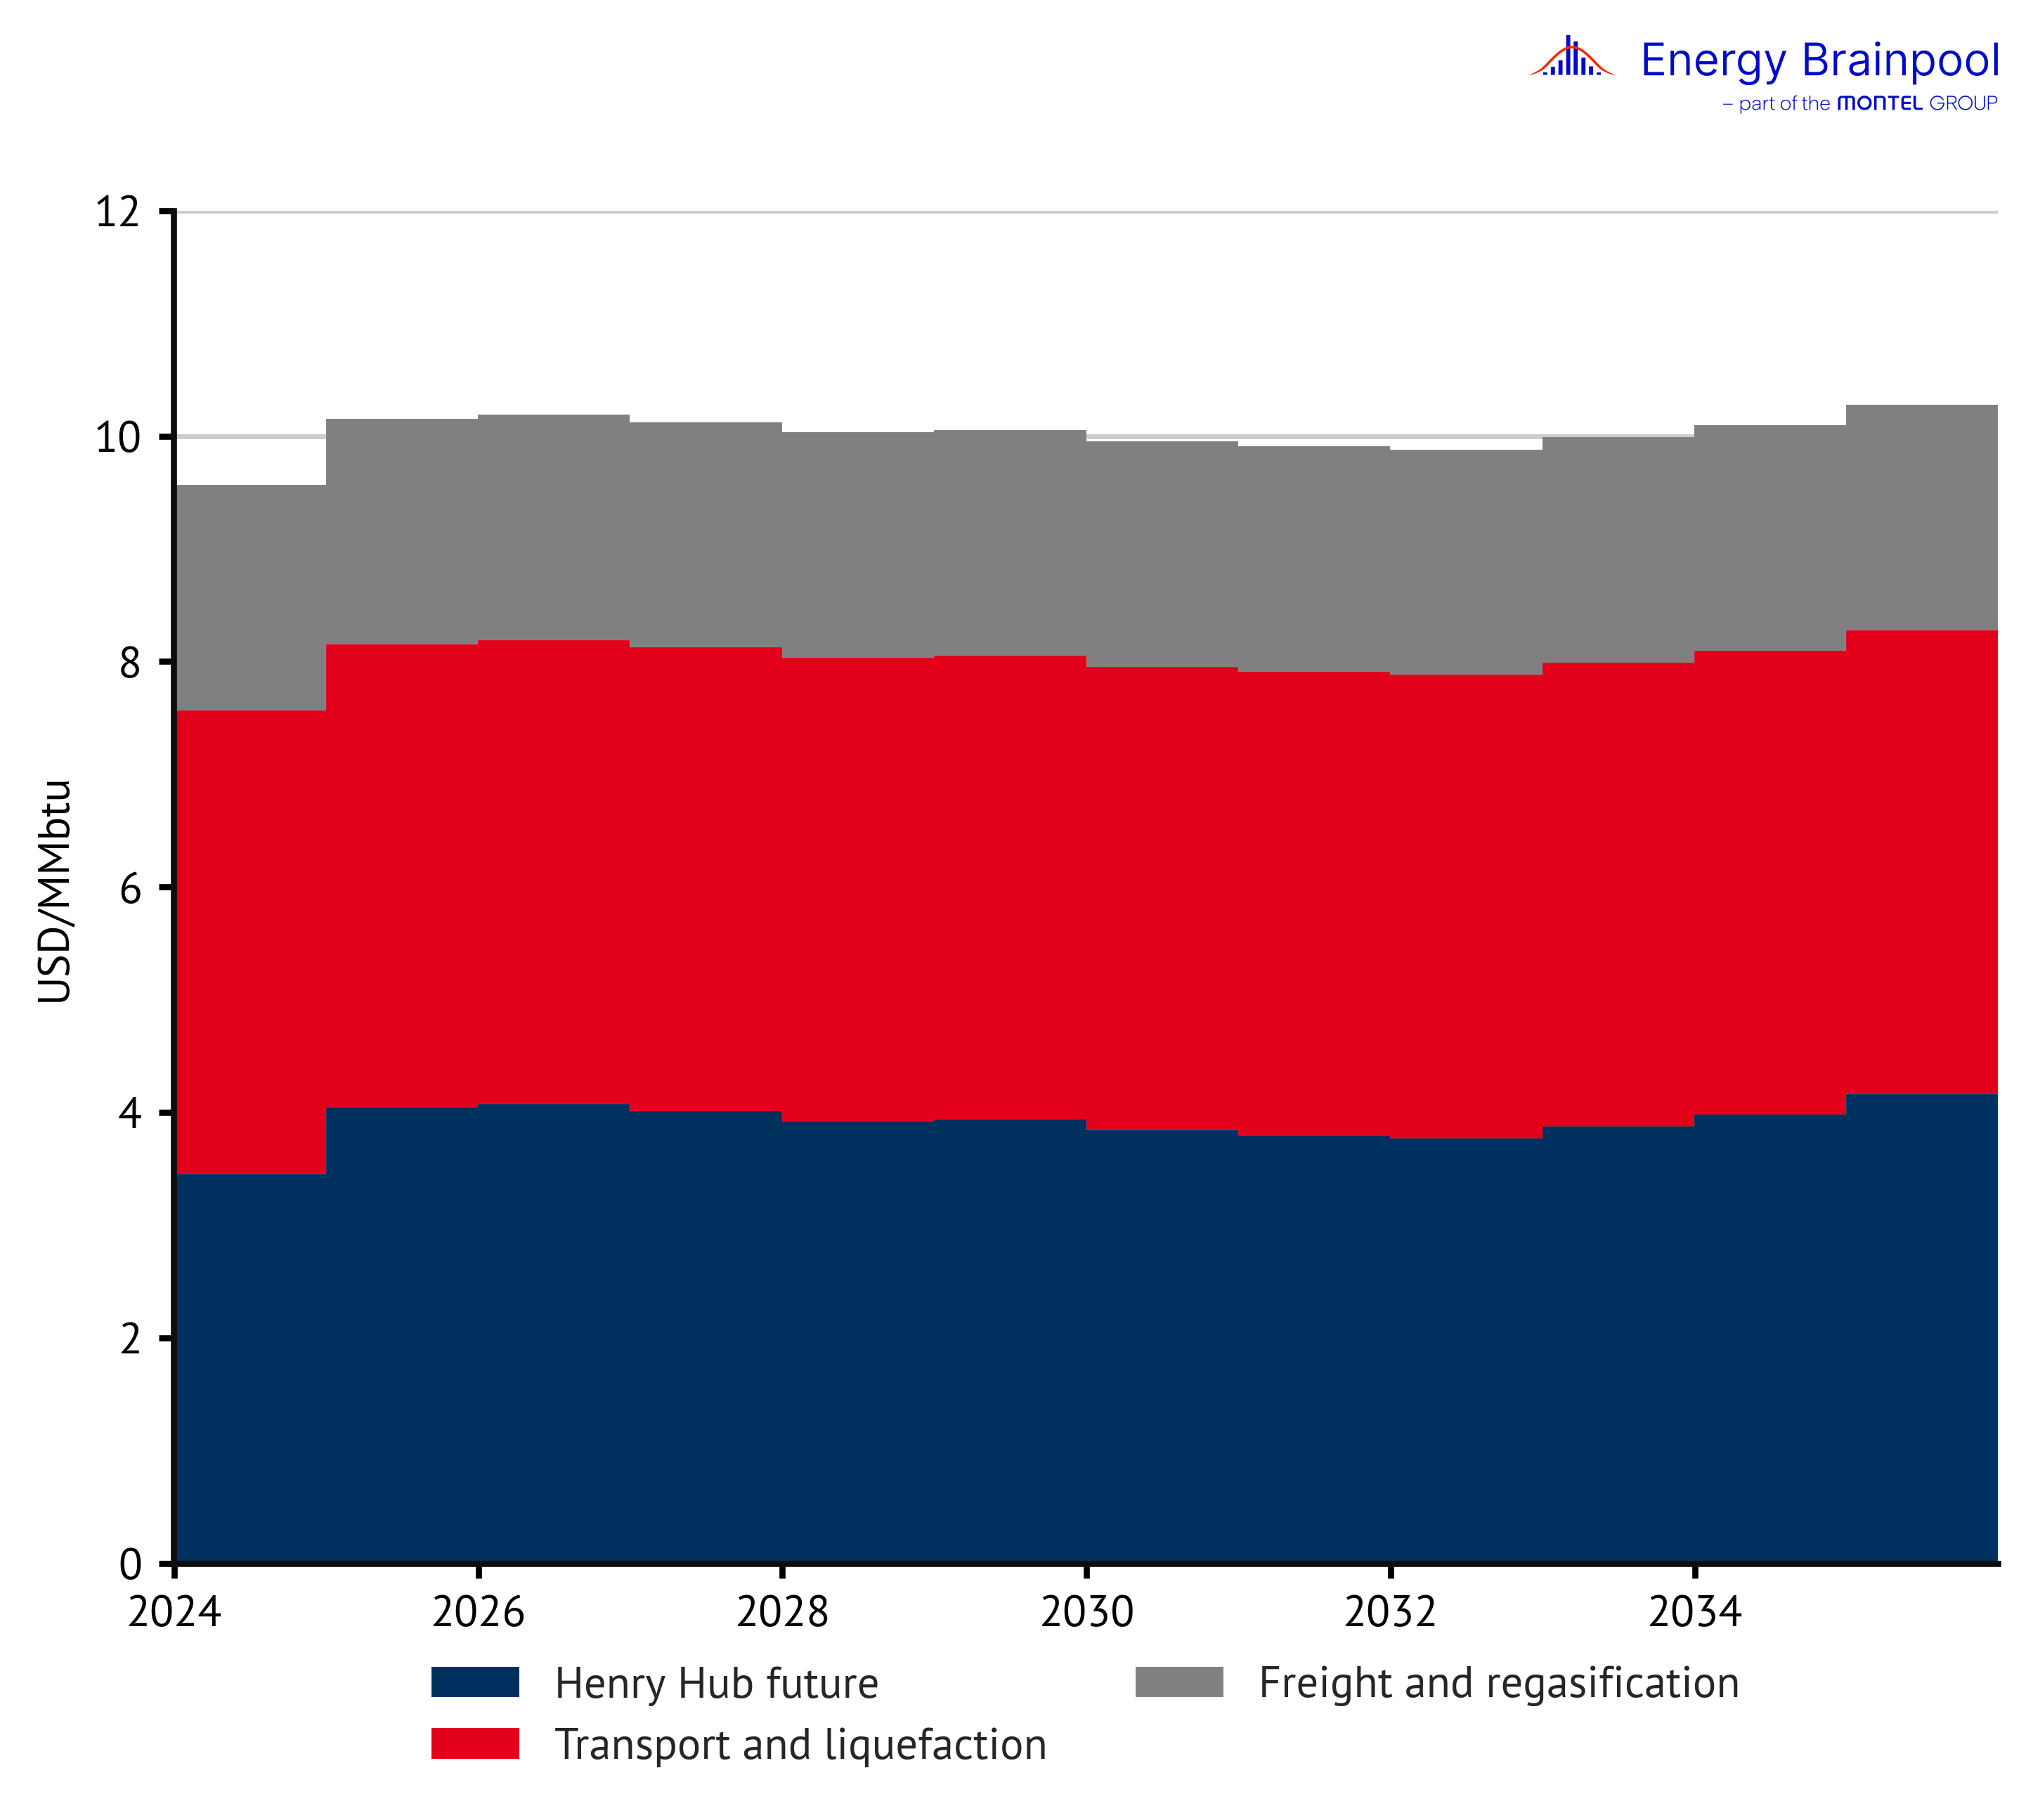
Figure 3: Cost components on the global LNG market (Source: US Office of Fossil Energy and Carbon Management, 2023)
The estimation of the natural gas price for the “Tensions” and “GoHydrogen” scenarios follows the same principle. However, instead of the average surcharges for transportation and liquefaction on the current future price for US natural gas, the maximum and minimum surcharges that have been observed over the last four years are used.
Figure 4 illustrates the scenario points for the natural gas price in 2030 and 2050 resulting from the assumptions described above. Only “Central”, “Tensions” and “GoHydrogen” are highlighted here, as “Central – Delayed EEG” shares the assumptions regarding the natural gas price with the “Central” scenario and therefore uses the same prices. In addition, the assumptions from the World Energy Outlook 2023 scenarios – in addition to APS, the “Stated Policies Scenario” (STEPS) and the “Net Zero Emissions by 2050” (NZE) are also presented to enable a comparison.
All EBP scenarios assume a higher natural gas price for 2030 than the International Energy Agency. As described above, the average, minimum and maximum level of the forecast global LNG market price is used as the basis for modelling for 2030. The price assumptions for the “Central”, “Central-Delayed EEG” and “GoHydrogen” scenarios up to 2040 then follow the same trend as the IEA’s “Announced Pledges” scenario. In the “Tensions” scenario, by contrast, the price of natural gas stagnates until 2040 with only minor fluctuations.
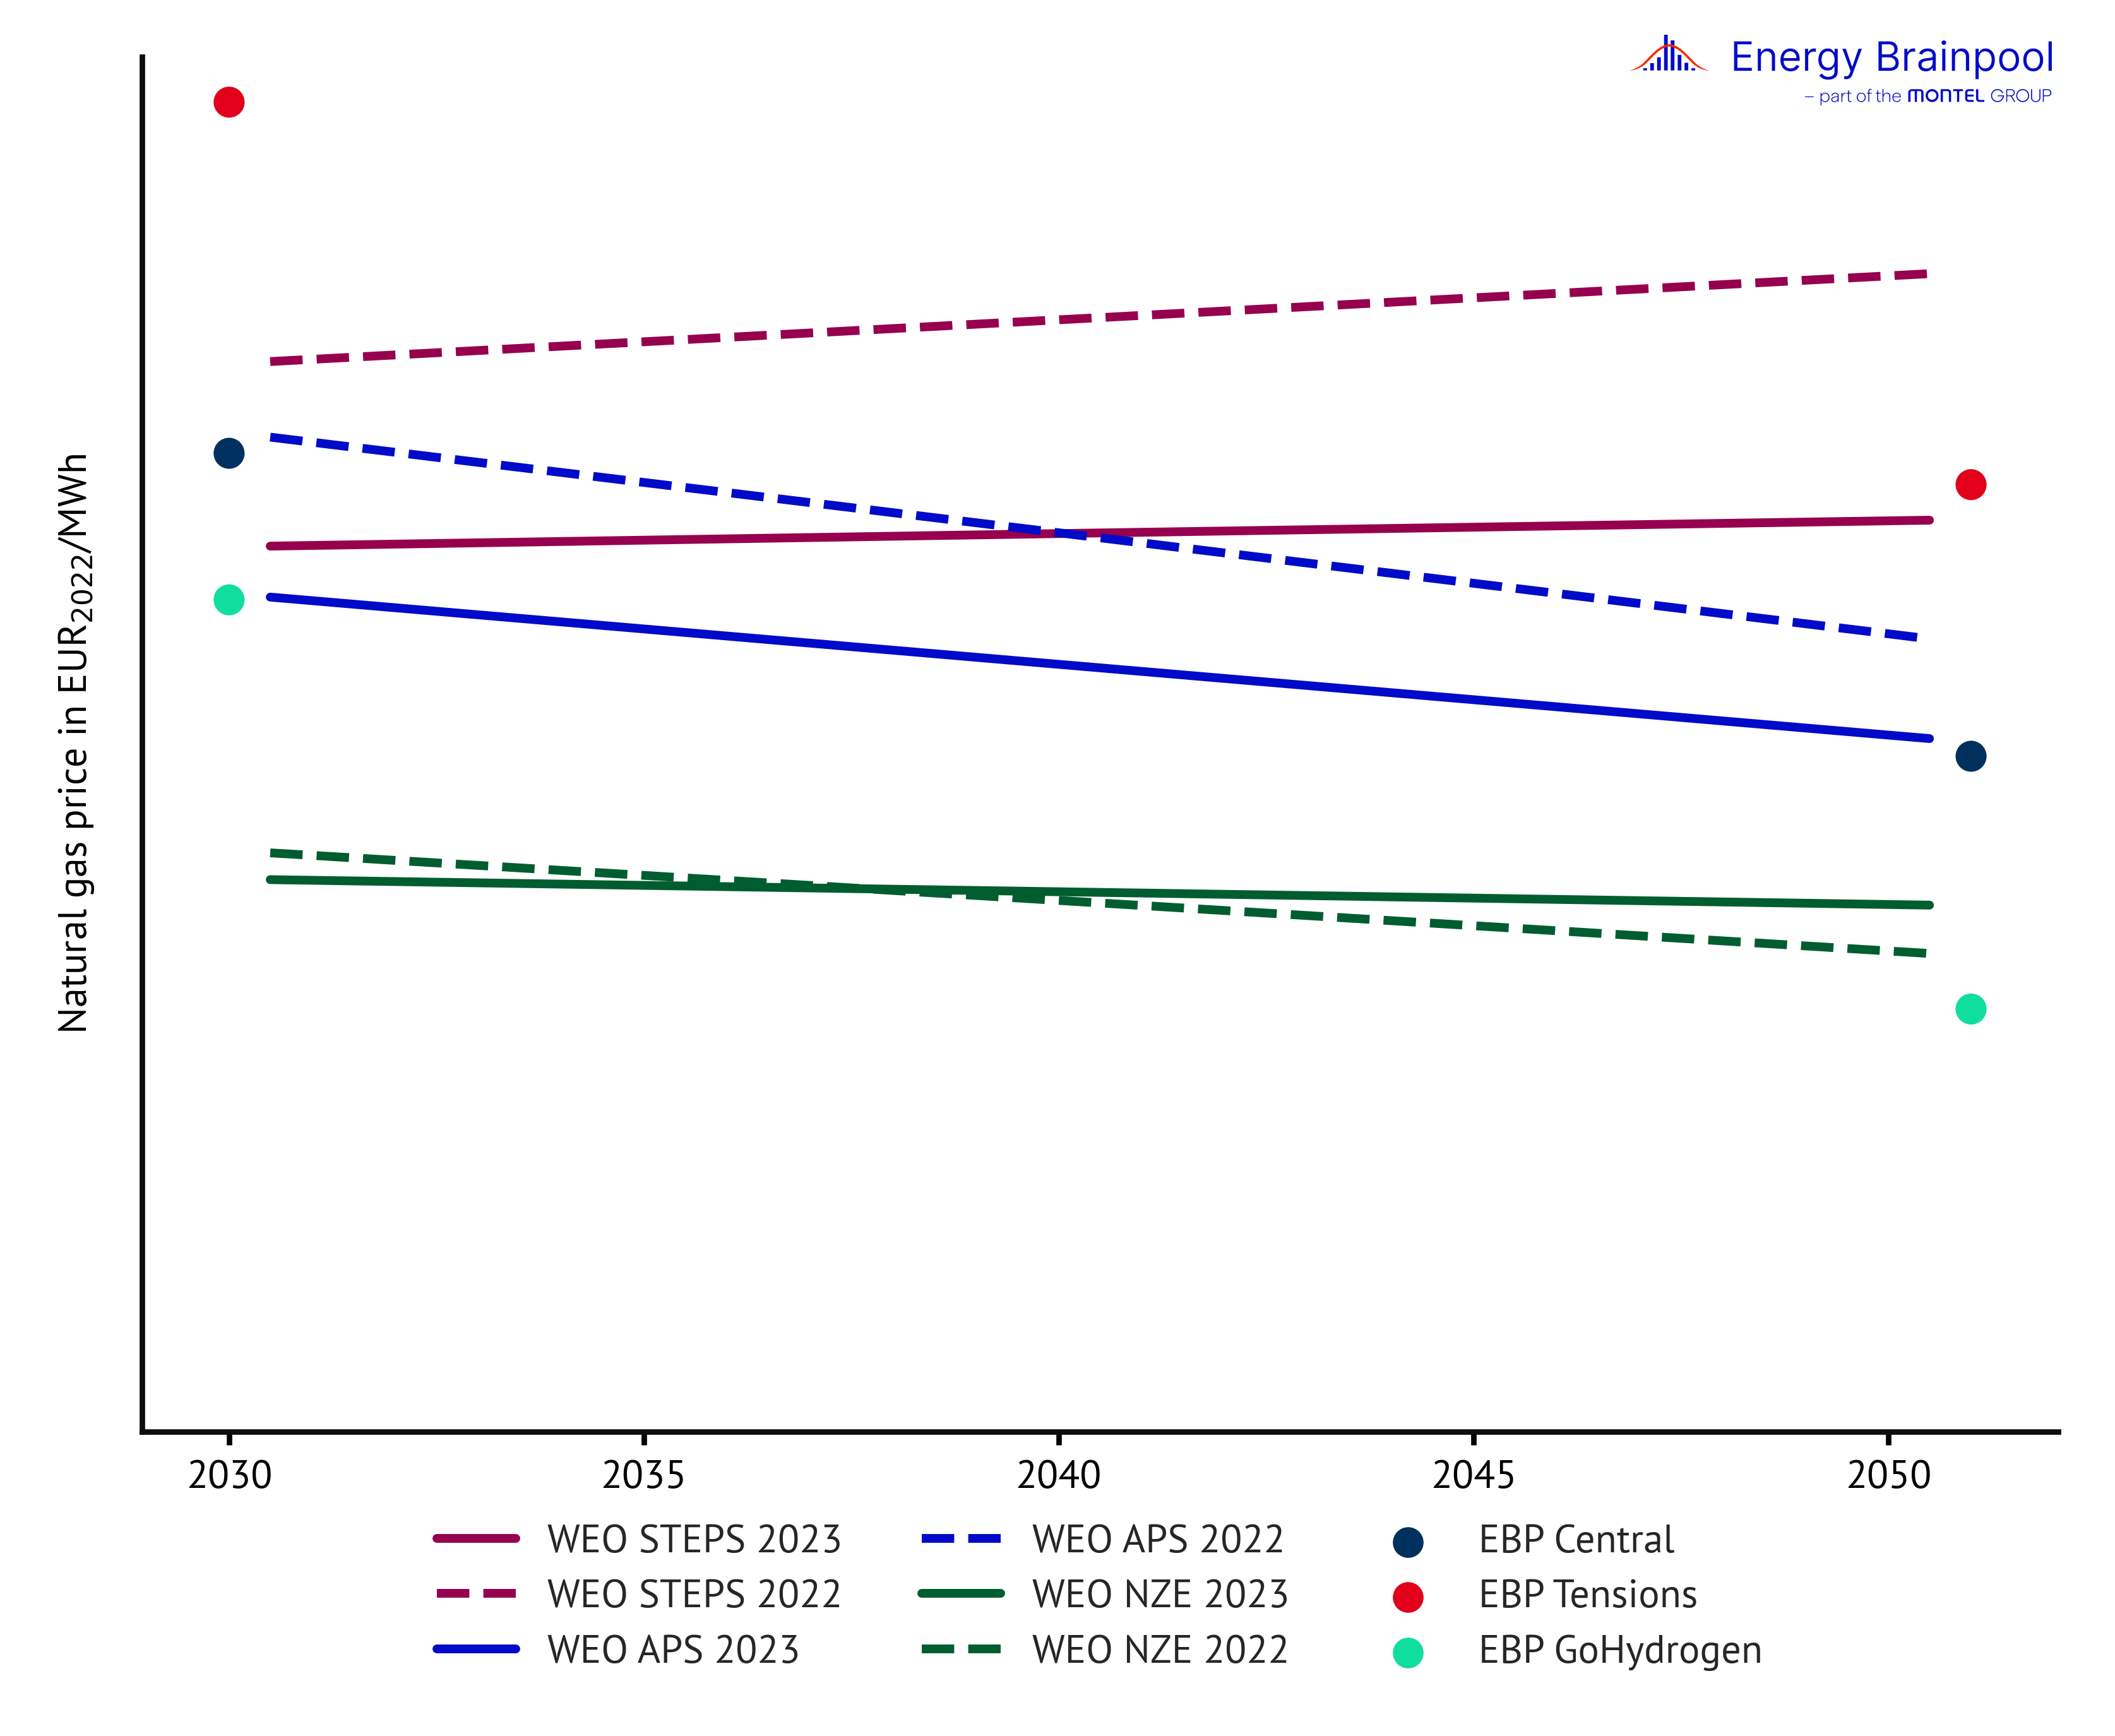
Figure 4: Natural gas price in the World Energy Outlook and in the EBP power price scenarios (Source: IEA World Energy Outlook, 2023; Energy Brainpool, 2024)
On a long-term basis, the gas markets worldwide will change significantly, as more and more applications of fossil natural gas are expected to be replaced by hydrogen. This hydrogen can be produced locally in Europe using energy-intensive electrolysis or imported, with MENA, America and Oceania in particular positioning themselves as future exporters.
Like natural gas, this “green” hydrogen will be traded on the global market and, as it becomes increasingly established, will compete with the “clean gas price” from 2040 at the very latest. The “clean gas price” here refers to a key figure for which the price of natural gas or comparable gaseous fuels is multiplied by the natural gas emission factor of 0.2 tCO2/MWhth after adding the EUA price.
Increasing awareness of emissions and costs for the general public, which were not originally priced into fossil fuels, will increase the price pressure on natural gas after 2040. As a result, hydrogen will gradually become more attractive than natural gas and take an ever larger share of the market.
By 2050, the price of natural gas in the “Tensions” scenario comes close to the price level in the IEA’s “Stated Policies” scenario. Meanwhile, the price of natural gas in the “Central” and “Central – Delayed EEG” scenarios approaches the price level from the IEA’s “Announced Pledges” scenario.
As the name suggests, the “GoHydrogen” scenario shows a world in which the supply of hydrogen on the global market is significantly greater and the price is therefore lower than in the other scenarios. Accordingly, this scenario results in a long-term price for gaseous fuels that is also below the level of the IEA’s “Net Zero Emissions” scenario.
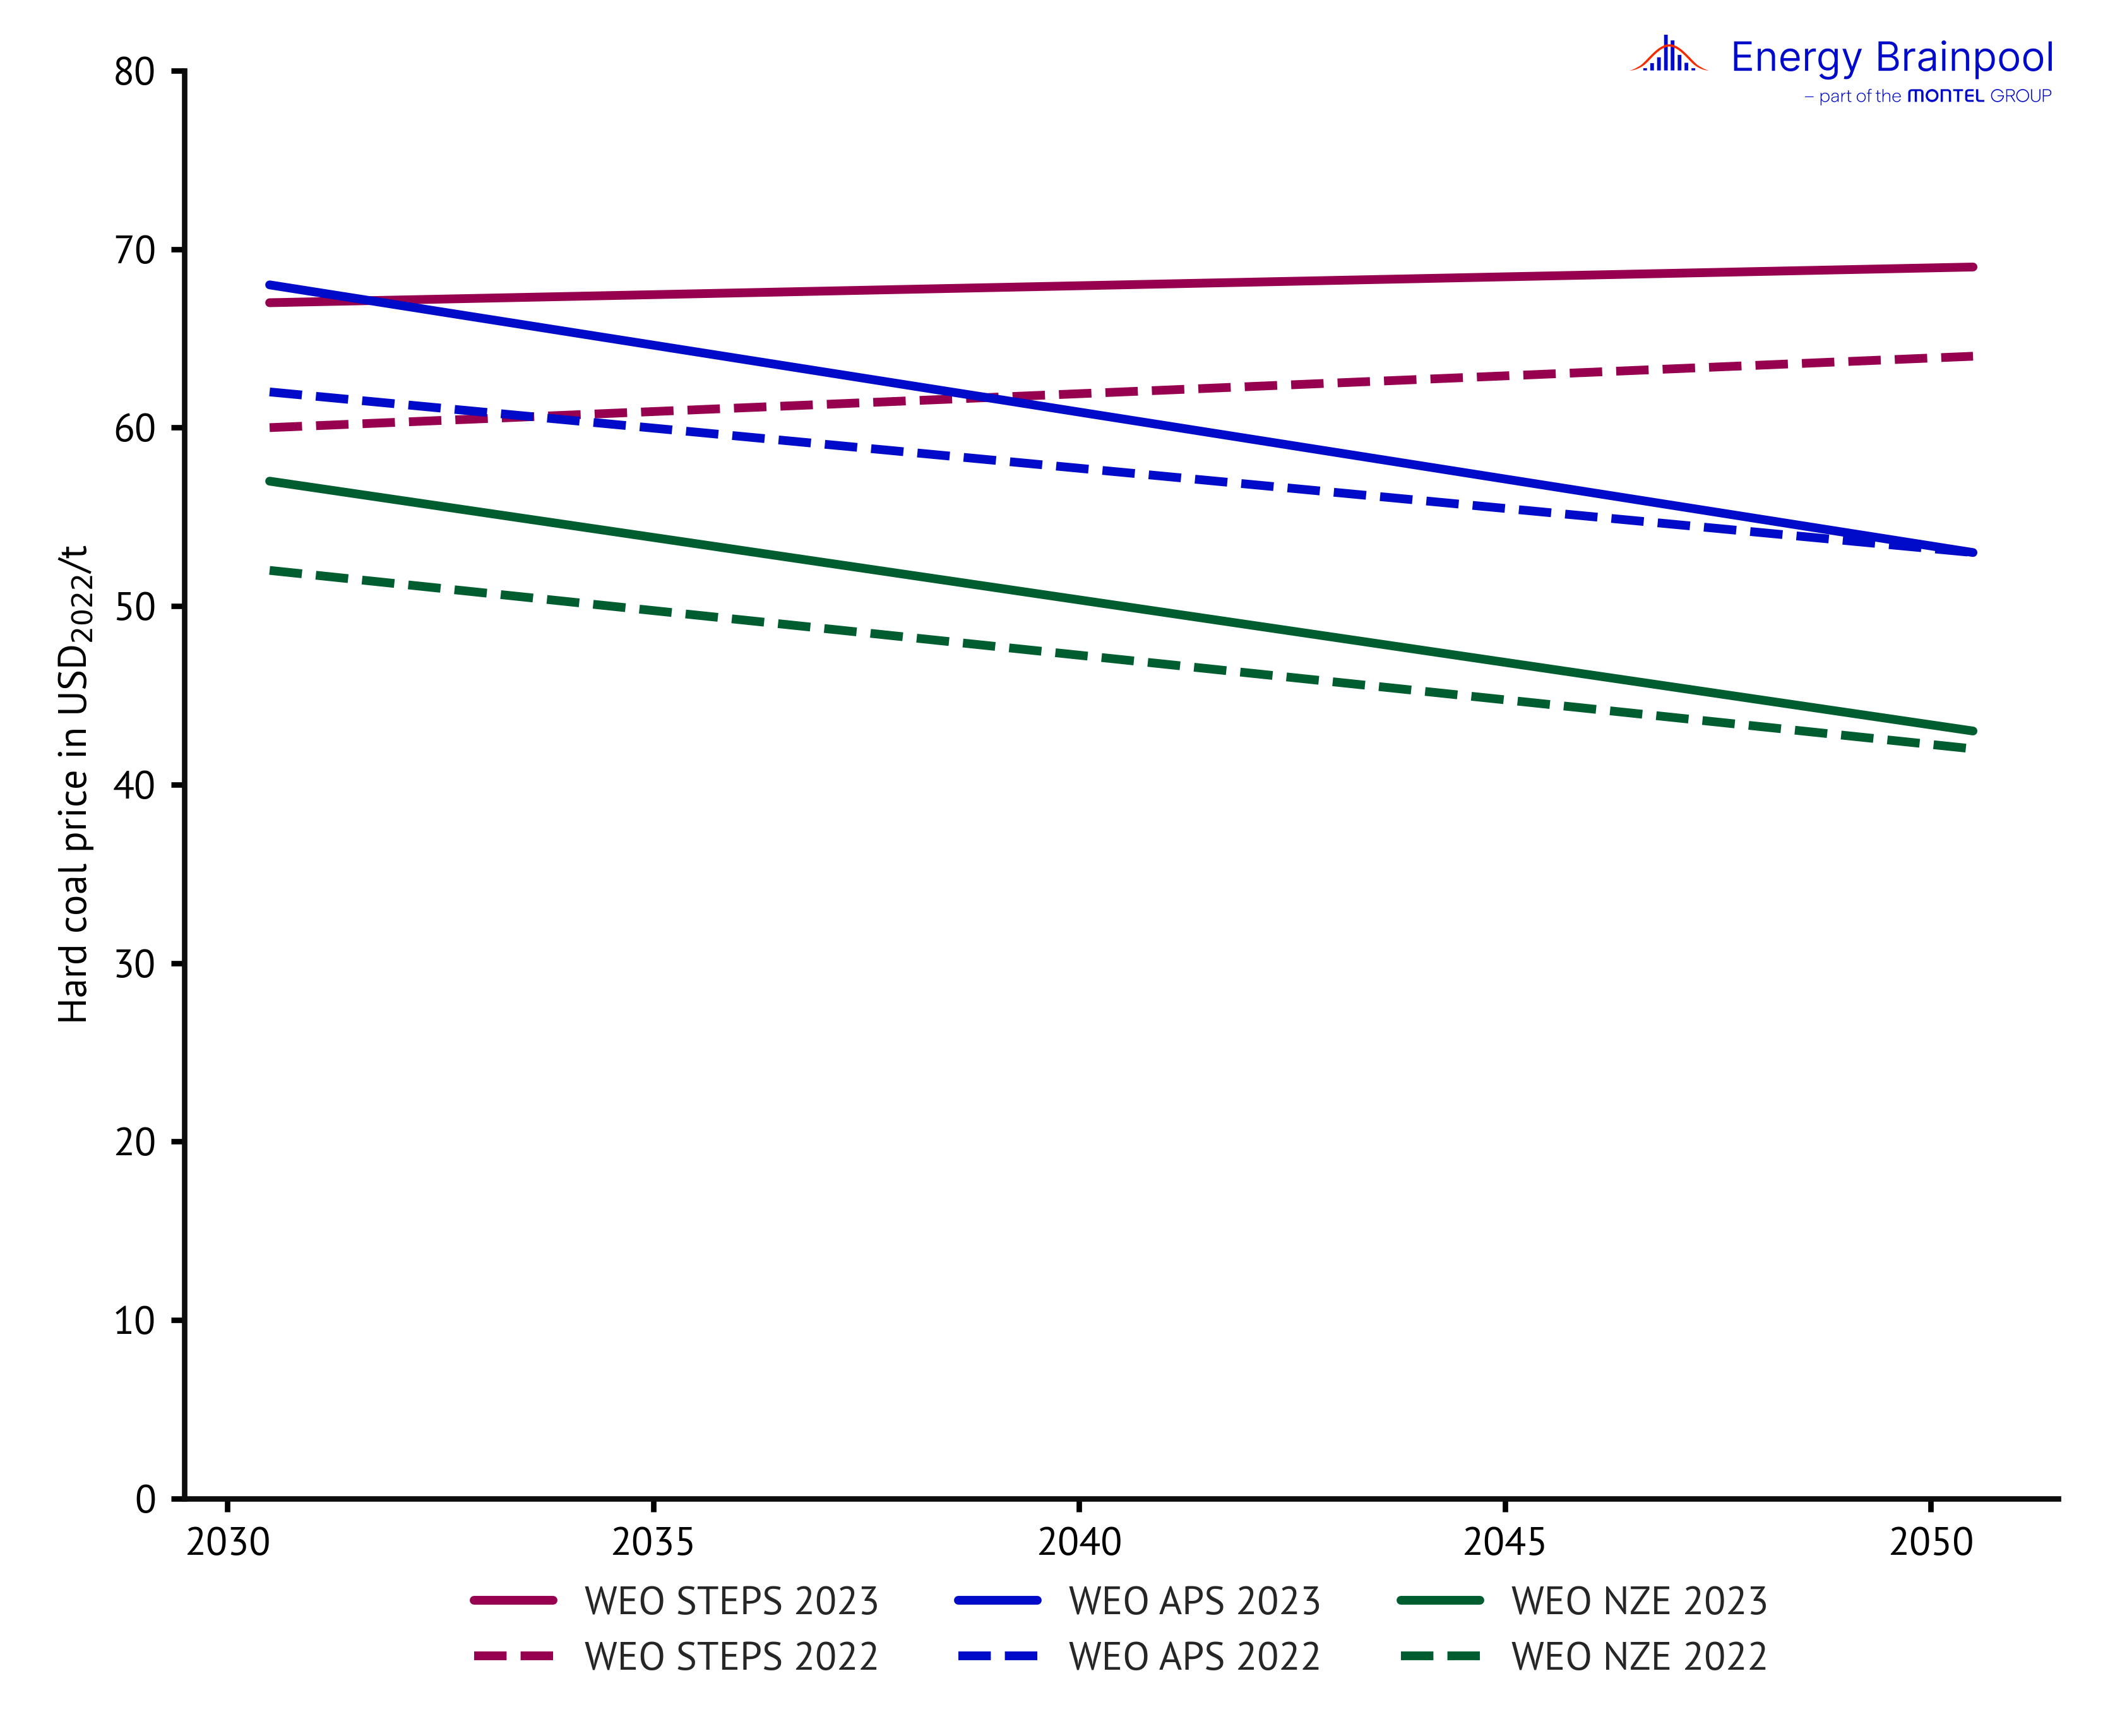
Figure 5: Hard coal price in the World Energy Outlook (Source: IEA World Energy Outlook, 2023)
In order to include the medium and long-term commodity prices for hard coal, crude oil and CO2 certificates from 2030 to 2060 in the power price model, Energy Brainpool adopts the assumptions of the IEA’s current World Energy Outlook. These are shown for hard coal and EUAs in Figures 5 and 6.
Compared to the previous World Energy Outlook, coal prices have moved upwards. This is the result of declining supply due to the Russian invasion of Ukraine and continued high demand, particularly in India and China. In contrast, CO2 prices only changed in the IEA’s “Stated Policies” scenario. On a long-term basis, the coal price shows a downward or near-stagnant trend in all three scenarios. In contrast, the CO2 price rises continuously.
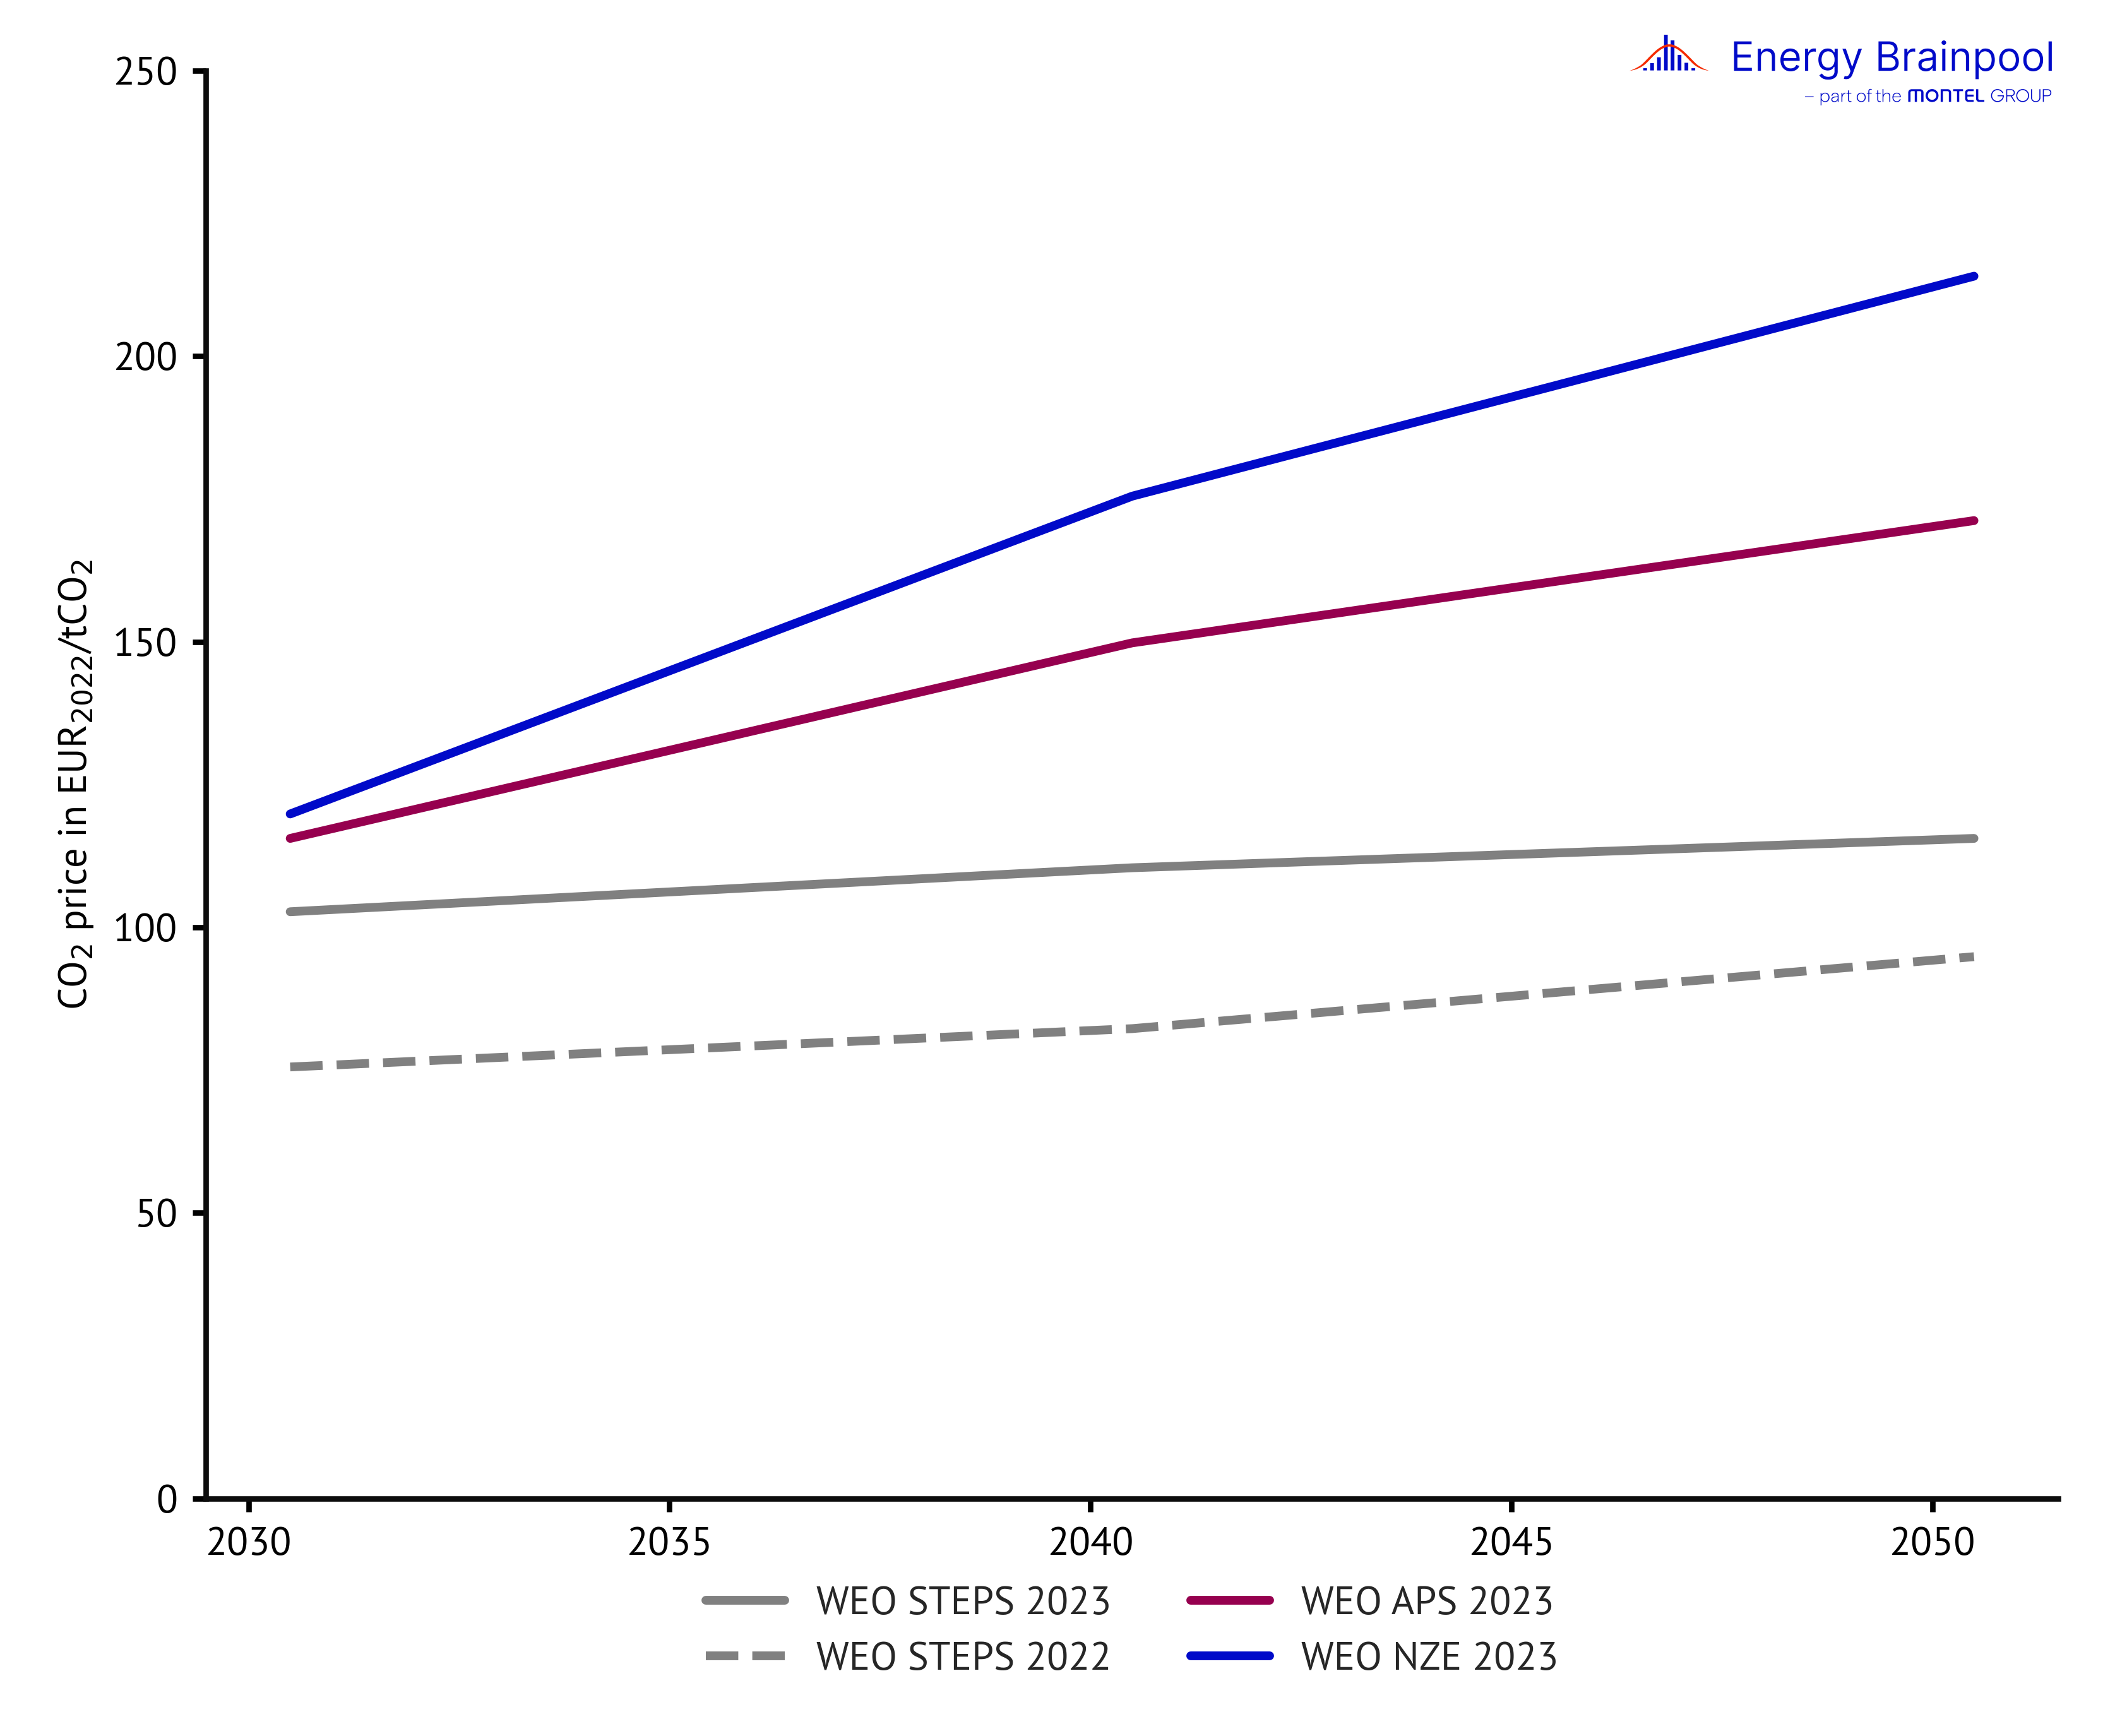
Figure 6: CO2 price in the World Energy Outlook (Source: IEA World Energy Outlook, 2023)
How will the European power plant fleet change in the coming decades?
Historically, many European countries have relied primarily on fossil-fuelled generating capacity to cover their energy needs. However, many of these power plants are now old and are gradually being taken off the market. At the same time, a growing awareness of climate change has contributed to the fact that only a few new fossil-fuel power plants are being built to replace the many fossil-fuelled power plants that are being decommissioned.
Almost all EU countries that still generate electricity from coal have now decided to phase out coal. In this way, they want to limit the negative effects of high CO2 emissions: Furthermore, some have already implemented their coal phase-out. Various conventional and renewable technologies are available for the future: Gas-fired power plants, renewable energies and, in some markets, nuclear power plants.
Wind power and photovoltaics in particular have great growth potential. Due to lower investment costs and already low operating expenses, they play a price-reducing role in the market. In the PPA sector in particular, there is great interest in renewable energy, especially solar energy.
However, it is to be expected that renewables will come under increasing economic pressure. The background to this is the significant expansion planned by the middle of the century, which will lead to a cannibalization effect – due to which the capture prices for wind farms and solar plants will fall.
In the “Central” scenario, the share of fluctuating renewable energies increases to around three quarters of the total supply capacity by 2050 (see Figure 7). In addition, their often simultaneous electricity generation lowers the hourly power price more and more often and to an ever greater extent. All renewable technologies (excluding hydrogen-powered gas turbines) together account for well over 80 per cent of the power plant fleet in 2060.
The “GoHydrogen” scenario models an increased expansion of renewable plants. This means that the installed generation capacities in Europe will significantly exceed 3500 GW by 2060. Compared to the “Central” scenario, more solar and wind power plants in particular will be built. These will already account for more than 80 per cent of total generation capacity by 2050.
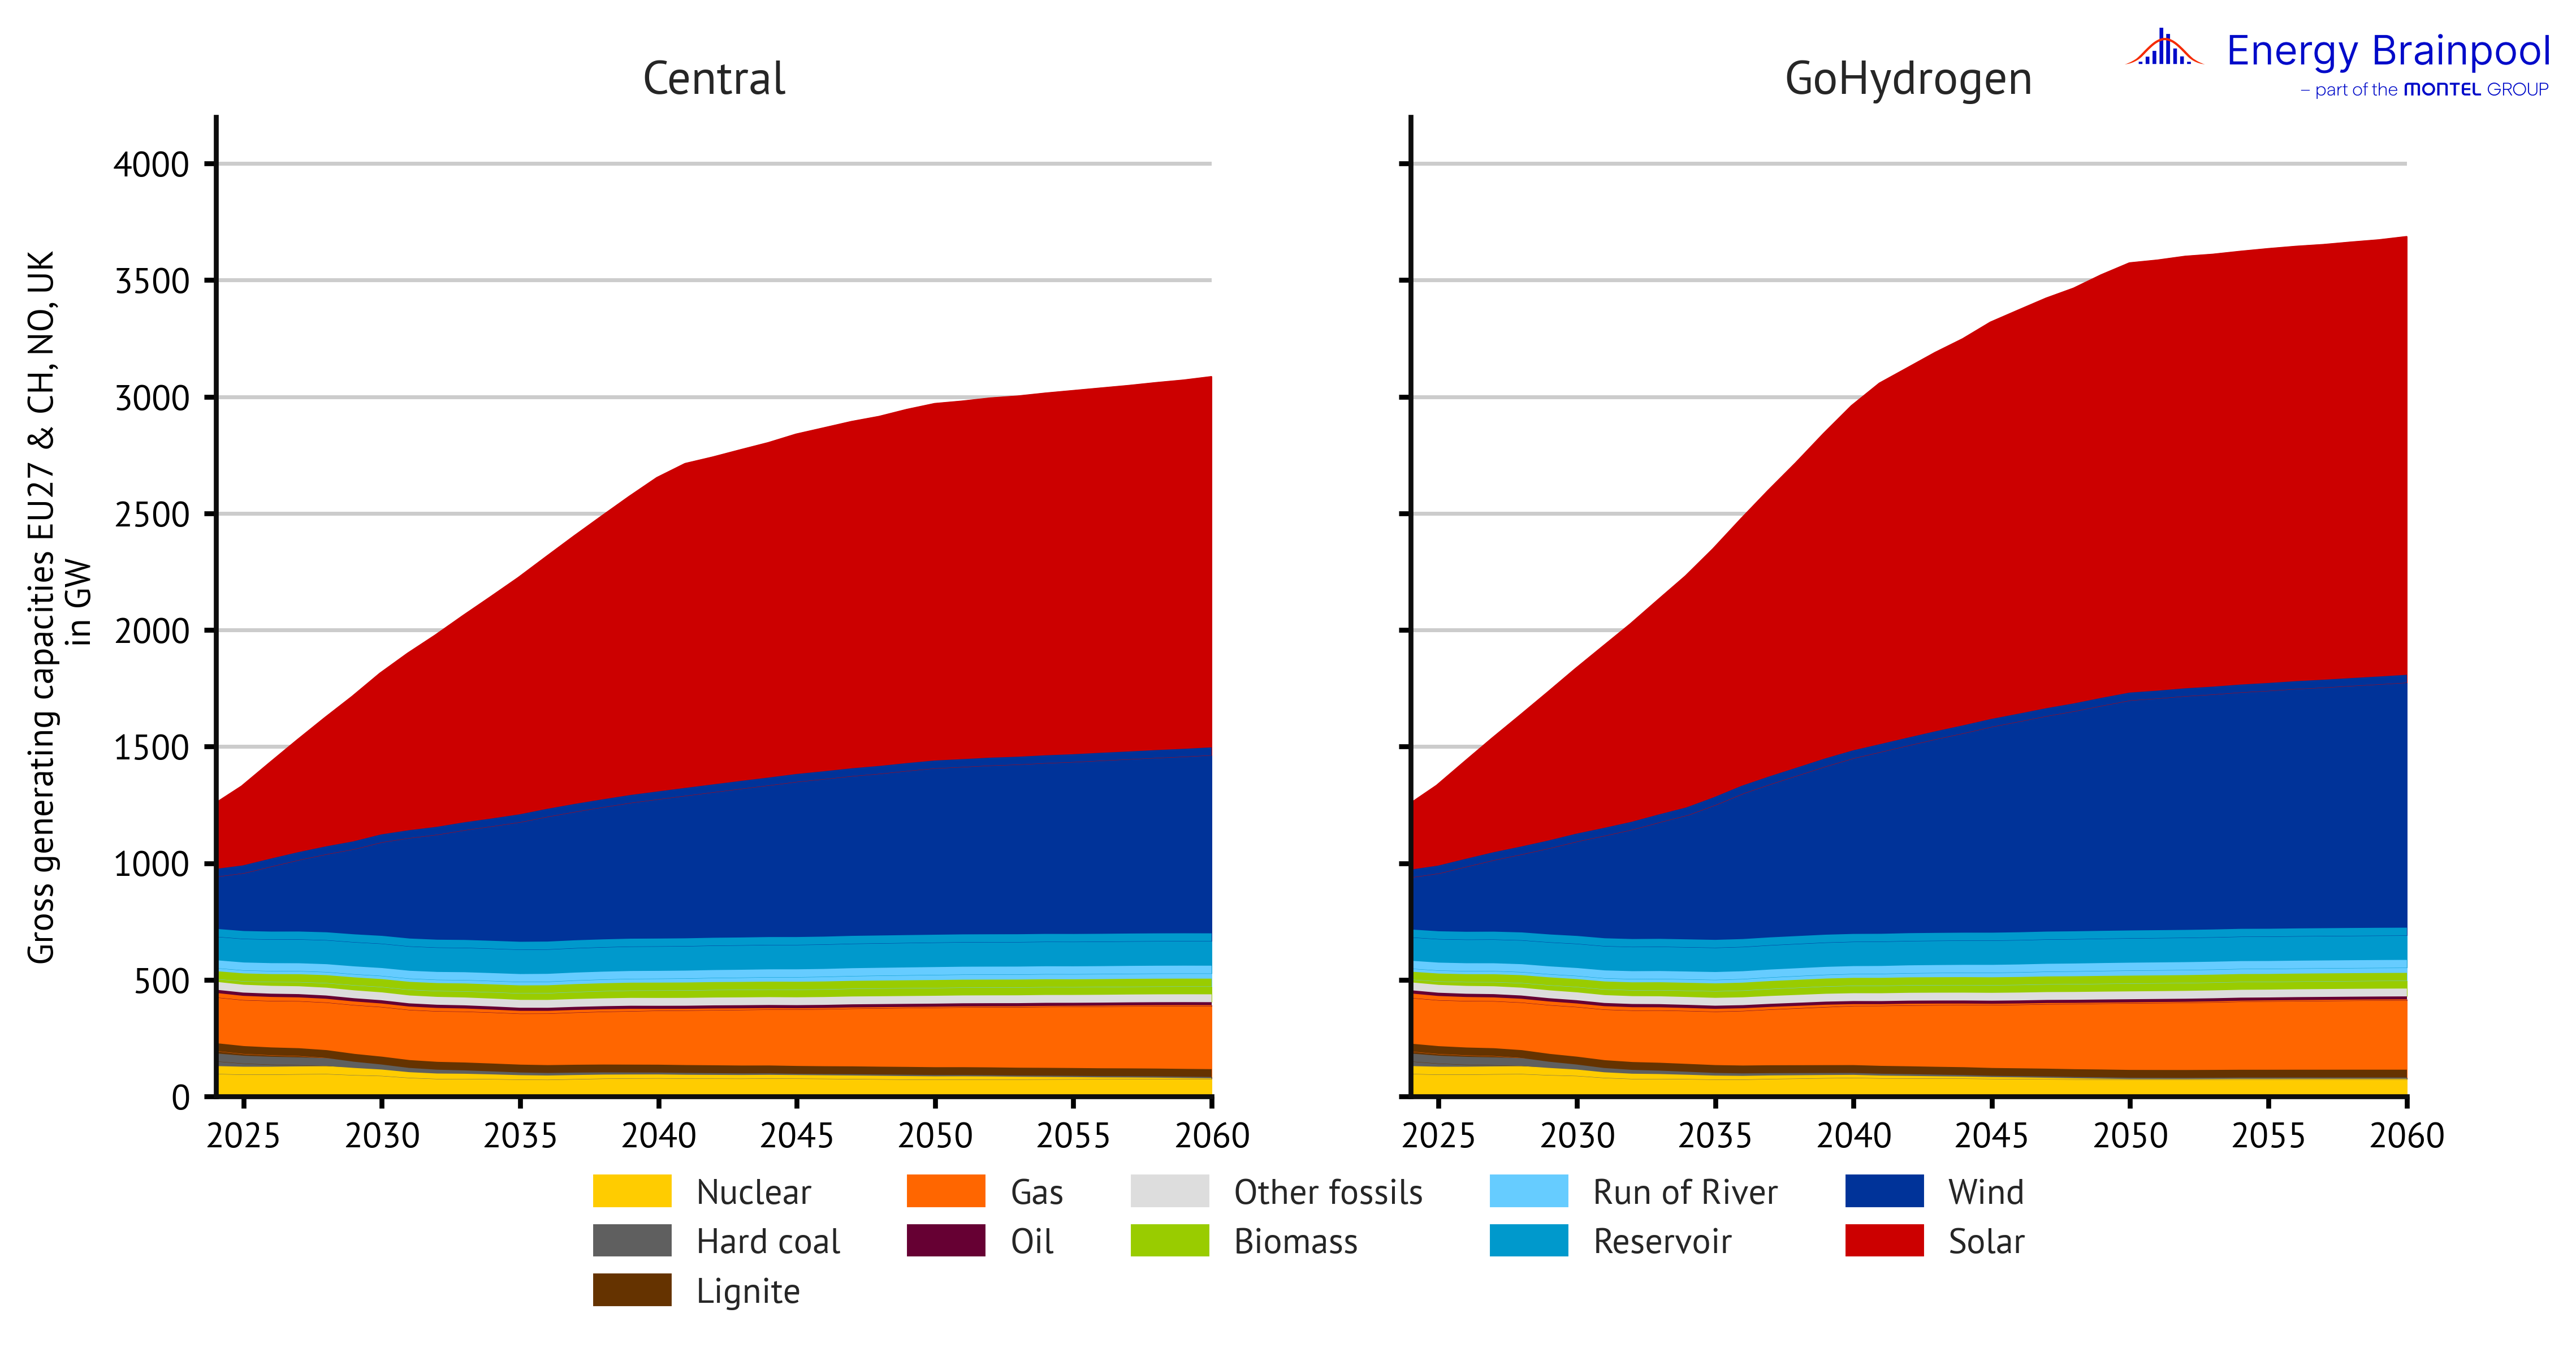
Figure 7: Installed generation capacities by energy source in the “Central” and “GoHydrogen” scenarios in EU 27, plus NO, CH and UK 7 (Source: Energy Brainpool, 2024; EU Reference Scenario, 2021; entso-e, 2024)
Gas-fired power plants in particular are often the focus of current discussions on security of supply. They offer the advantage that they can be controlled very flexibly and produce lower emissions than coal-fired power plants, which – even with carbon capture and storage (CCS) – are not cleaner than gas-fired power plants. In modern, “H2-capable” gas turbine power plants, hydrogen and other synthetic gaseous fuels can also be burned instead of fossil natural gas. This means that gas turbines and combined cycle power plants will no longer be fossil-fuelled power plants in the long term. Instead, they will at least partially be classified as “emission-free” power plants.
This also makes them interesting for implementing the energy transition. The German government just published a power plant strategy in February 2024, according to which, among other things, the construction of H2-capable gas-fired power plants is to be promoted. The aim is to secure sufficient capacity to phase out coal in Germany by 2030.
Energy Brainpool had already modelled this expansion path for gas capacity in the power price scenarios (approx. 45 GW of gas-fired power plants by 2030) before the power plant strategy was announced. The new power plant strategy makes it clear that gas-fired power plants will remain an important factor in electricity generation in the long term. A detailed discussion of the power plant strategy and its implications can be found in a blog article on this topic.
With gas and nuclear power plants, the share of emission-free generating capacity increases to 99 percent in 2050 in the “Central” scenario. Even in the “GoHydrogen” scenario, modern, “H2-capable” gas turbine power plants, which burn hydrogen and other synthetic gaseous fuels in addition to fossil natural gas, remain relevant. These are therefore no longer necessarily considered to be fossil-based power generators, but are mostly counted as “emission-free” power plants. This means that practically all generation capacity in this scenario will be emission-free by 2050.
New in this quarterly update, the “Tensions” and “Central-EEG Delayed” scenarios show the consequences of insufficient capacity expansion in the gas sector and thus a delayed coal phase-out by 2038. Energy Brainpool has succeeded in quantitatively examining the effects on the baseload price and the capture prices of renewables. On a medium-term basis, a delayed coal phase-out would lead to slightly lower prices with significantly higher emissions. However, in the long term, power prices are higher than in the “Central” scenario.
Over the course of the coal phase-out, the capacities of coal-fired power plants in the “Central” scenario are reduced by over 80 percent by 2050 and by over 90 percent by 2060. Following the shutdown of the last German nuclear power plants last year, the “Central” scenario shows a further decline in installed capacity in the form of nuclear power in Europe by 2050. This means that the share of generation capacity from controllable thermal power plants (including gas) in Europe will fall by more than half from its current level of around 40 per cent by 2050.
In the quarterly update, Energy Brainpool has adjusted the nuclear capacity in the modelling for France in accordance with the draft “Energy Sovereignty Bill”. The bill provides for the lifetime of the existing French nuclear power units to be extended after 2030 and for new units to be added in the 2030s. This means that nuclear power will remain a mainstay of the decarbonisation of the French energy supply. Meanwhile, the previously set targets for the expansion of renewable energies will no longer be pursued. The additional generation in the model leads to lower power prices in France and also in many neighbouring bidding zones/countries such as Spain, Portugal and Belgium. However, it remains questionable whether the expansion is realistic on time and without massive state subsidies.
In addition to emissions, the changes in the power plant fleet also have an effect on the structure of power prices. These are increasingly characterised by fluctuating renewable energies and therefore show greater volatility. In the “GoHydrogen” scenario, nuclear and coal-fired power plants are dismantled along the same path as in the “Central” scenario. However, the increased expansion of renewable plants reduces the share of controllable thermal power plant generation capacity (including gas) in the “GoHydrogen” scenario from currently around 40 percent to around 12 percent by 2050. As a result, power prices in this scenario are even more strongly influenced by fluctuating renewable energies than in the “Central” scenario.
Growing demand for electricity by 2060 requires changes in electricity generation
The electricity demand will increase about 64 percent by 2050 and about 71 percent by 2060 according to “Central” scenario (see Figure 8). Electricity demand increases primarily due to:
- the increasing use of hydrogen (spread of fuel cell technology in the transportation sector and increased use of hydrogen in steel production and in the chemical industry), for which targets are defined in the national hydrogen strategies of the individual countries,
- the increased electrification of various energy services in households (in particular through the spread of heat pumps and other electric heating applications for the provision of hot water and space heating),
- as well as the increase in electromobility.
According to the political plans modelled by the European Commission in a reference scenario [1], economic growth will concentrate primarily in the tertiary sector in the coming decades, which is expected to see a significant increase in demand of electricity. Even though industry is traditionally very energy-intensive, efficiency improvements will prevent the demand for electricity in this sector from increasing significantly.
Electrification plays an important role in the “GoHydrogen” scenario, in which a higher demand for electricity is modelled for both household applications and transport. This means that the demand for electricity generally increases. The increased use of hydrogen, particularly in industry and transport, which characterises this scenario, also results in higher electricity consumption. This results from the production of hydrogen using electrolysers, which creates a high flexible demand for electricity. For these reasons, the sum of inflexible and flexible demand for electricity in the “GoHydrogen” scenario will exceed the demand for electricity in the “Central” scenario by around 1000 GW in 2050.
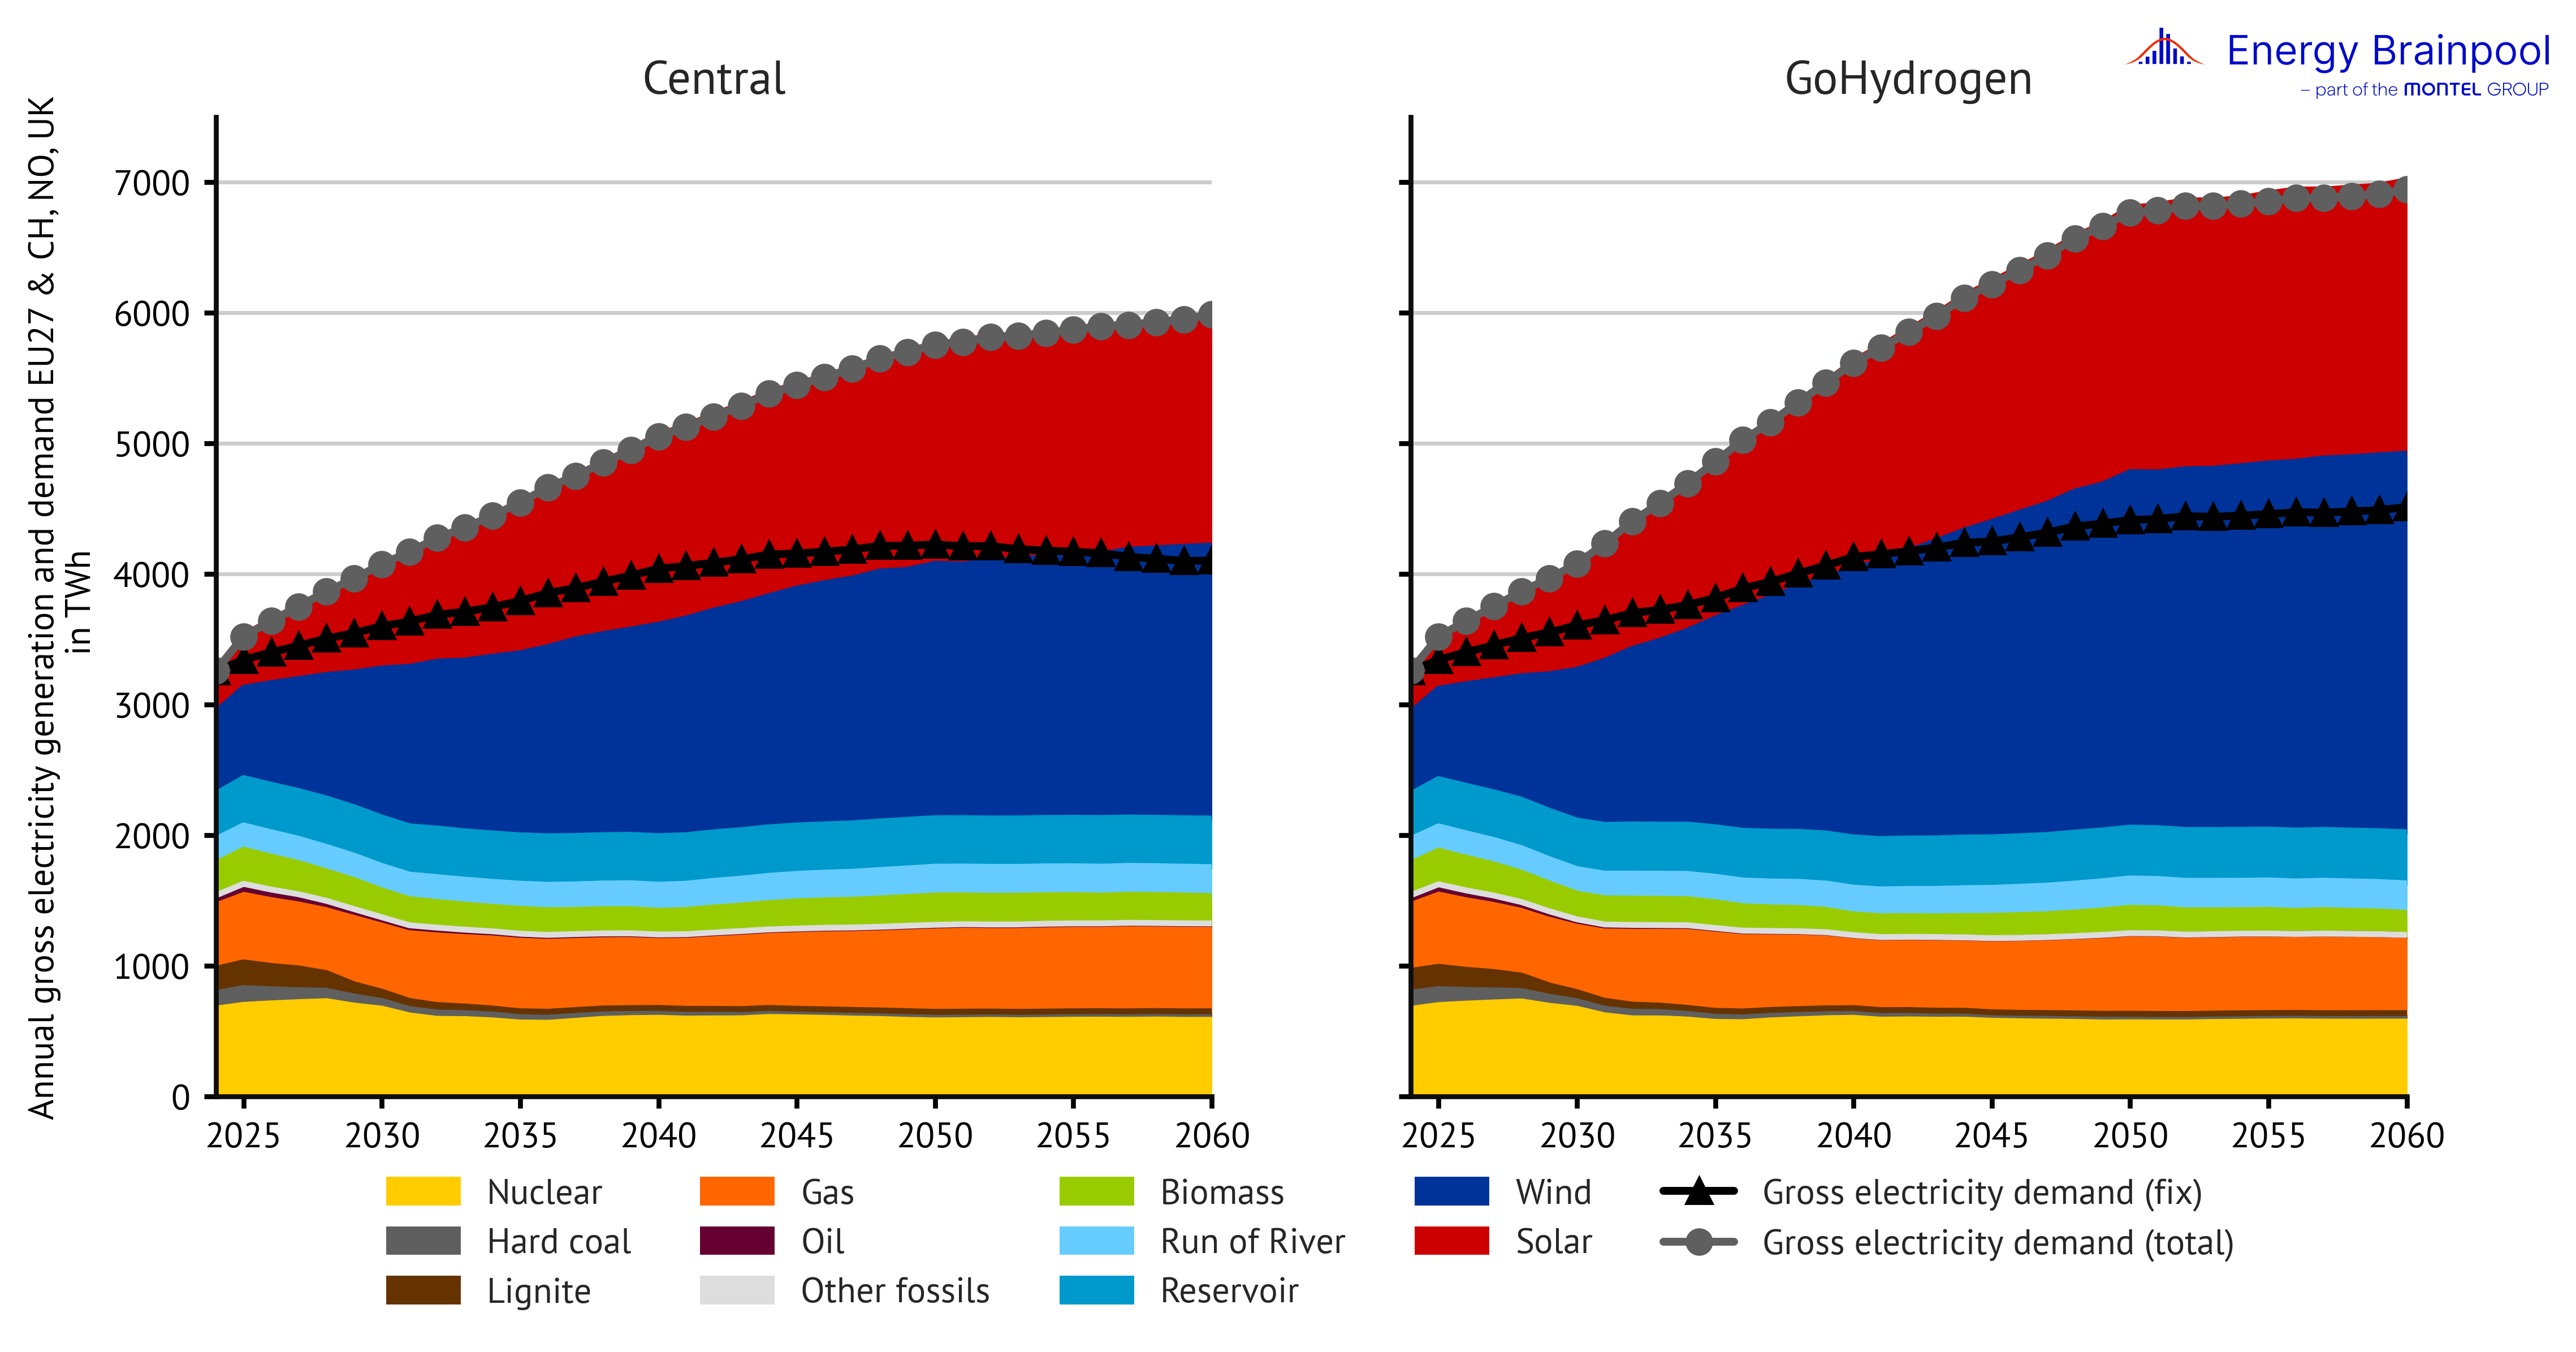
Figure 8: Gross electricity generation and demand by energy source in the “Central” and “GoHydrogen” scenarios in the EU 27, plus NO, CH and UK (Source: Energy Brainpool, 2024; EU Reference Scenario, 2021; entso-e, 2024)
First of all, it is noticeable that the amount of electricity produced from coal-fired power plants falls rapidly in both scenarios. It falls by over 70 percent by 2030. Subsequently, by 2050, it falls by over 90 percent in the “Central” scenario and even more in the “GoHydrogen” scenario. In contrast, electricity production from gas-fired power plants remains almost constant until 2050.
In the “Central” scenario, more than three quarters of electricity generation will come from renewable energies in 2050. At just over 60 percent, wind and solar power plants account for the largest share. The importance of renewable energy sources is even higher in the “GoHydrogen” scenario, where just over 80 percent of electricity will be provided by renewable plants in 2050, the majority of which will come from wind and solar power plants. The remaining electricity from renewable energies will be provided by controllable renewable energies such as biomass power plants or storage reservoirs if wind and solar do not provide the necessary amount of electricity.
In addition to renewable energies, other emission-free energy sources are also relevant, supplying almost 20 % of the electricity generated in the “Central” scenario in 2050. More than half of this comes from nuclear power plants. Another very important share comes from gas-fired power plants, where green, emission-free hydrogen is burned.
In the “Central” scenario, more than 90 % of electricity is generated emission-free in 2050. Although nuclear power plants provide the same amount of electricity in absolute terms in the “GoHydrogen” scenario as in the “Central” scenario, their higher total power generation results in a lower percentage share of electricity generation.
In the case of gas turbines, the scenarios differ in terms of how much electricity is generated emission-free with hydrogen. In the “GoHydrogen” scenario, almost 100 percent of electricity will be generated emission-free in 2050.
The future development of average power prices
How will the baseload price develop in the coming decades? It denotes the unweighted average price for electricity on the day-ahead spot market over all hours of a year. All the assumptions on which the model is based, which have been discussed so far, from commodity and CO2 prices to changes in the power plant fleet and the development of electricity demand, play a role here.
The analysis of the individual factors results in an estimate of future power prices. The development of average power prices in the various scenarios is shown in Figure 9.
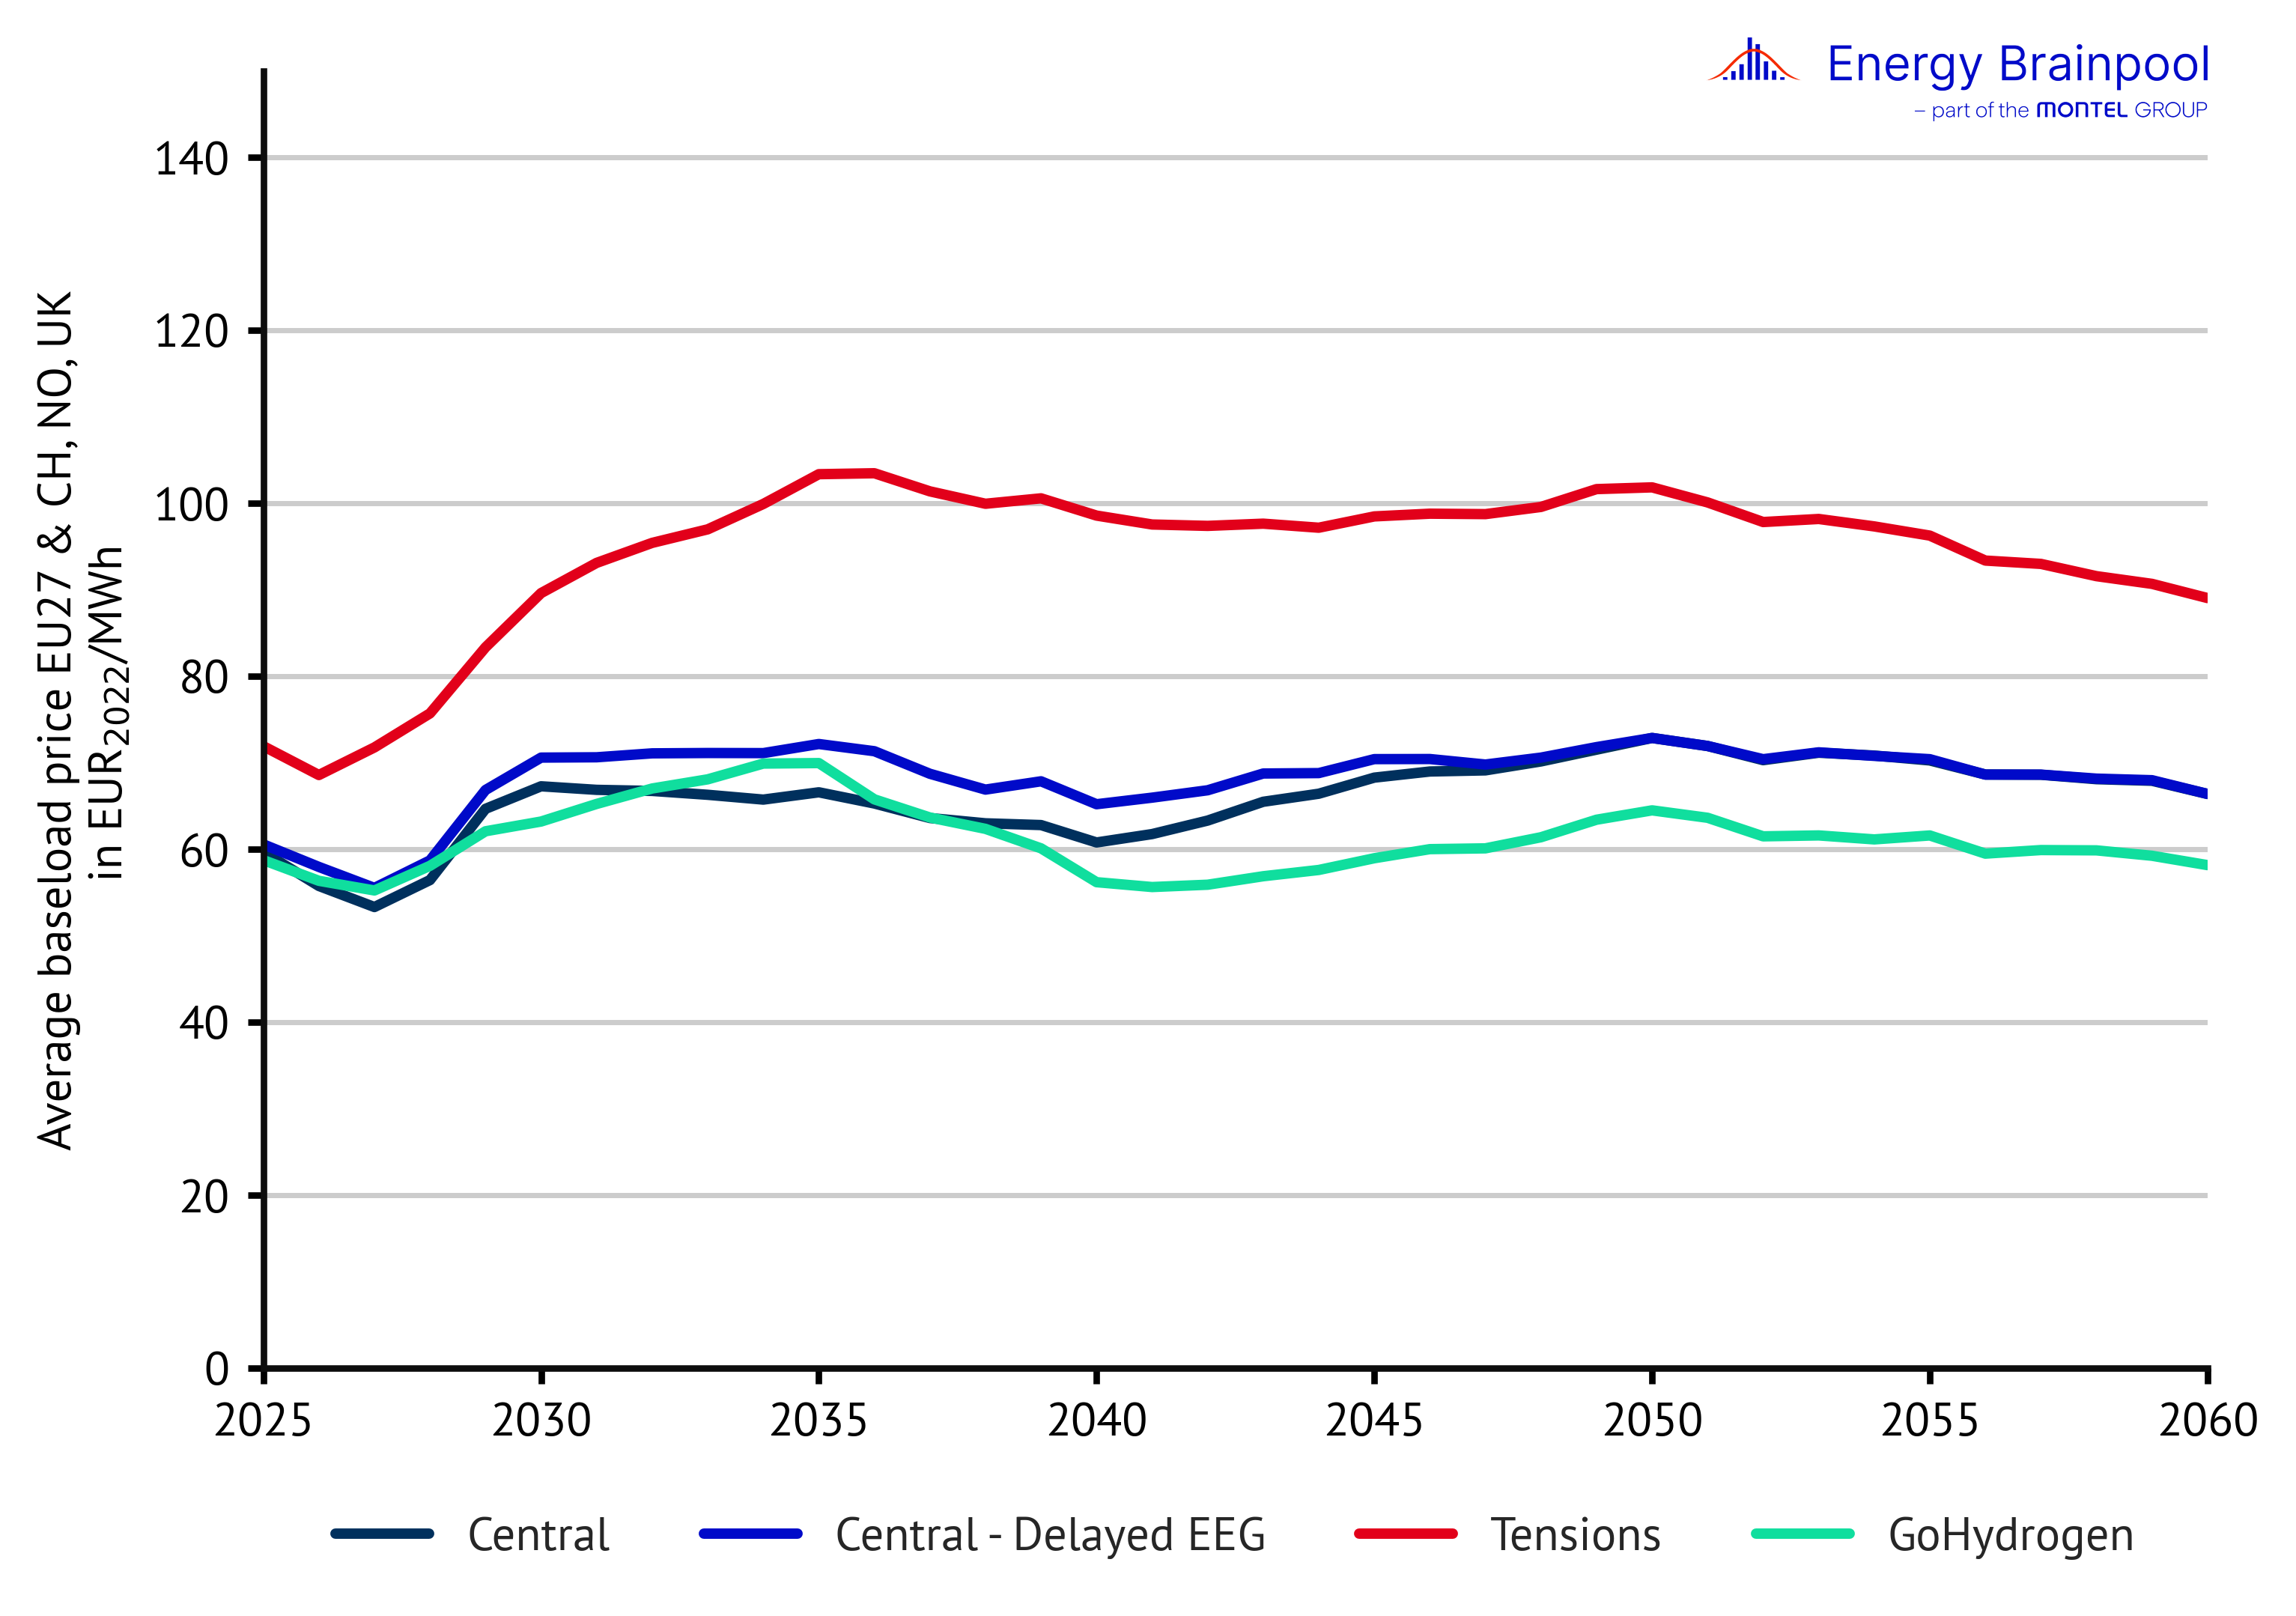
Figure 9: Development of real power prices in the respective scenarios (Source: Energy Brainpool, 2024)
The market situation on the futures markets has relaxed noticeably in recent months, meaning that power prices are also following a downward trend. As the expansion of wind and solar parks progresses, feed-in from renewable sources is also increasing. This is also pushing prices down. As a result, there are increasingly hours with low and – in countries with subsidy systems for renewable energies or pronounced “must run” capacities – often negative power prices.
At the same time, conventional capacities are also being scaled back. Meanwhile, new controllable power plants are still under construction. And CO2 prices are also expected to rise in the coming years. This results in a slight increase in real power prices in the “Central” scenario between 2030 and 2060, with a more significant increase at the end of this decade and a slower increase in the 2040s.
The “GoHydrogen” scenario, on the other hand, shows a more significant drop in power prices from 2035 onwards. The price then settles at a permanently lower level, with certain fluctuations, until 2060 compared to the “Central” scenario. In this scenario, there are higher feed-ins from wind and solar power plants. This leads to more hours with low and negative prices than in the “Central” scenario.
Compared to the last edition of the EU Energy Outlook from November 2023, power prices have fallen slightly in some countries. This is mainly due to the changes in expansion plans for conventional and renewable energy sources. Figure 10 also shows the nominal baseload prices, which only differ from the real prices in the inclusion of an inflation factor.
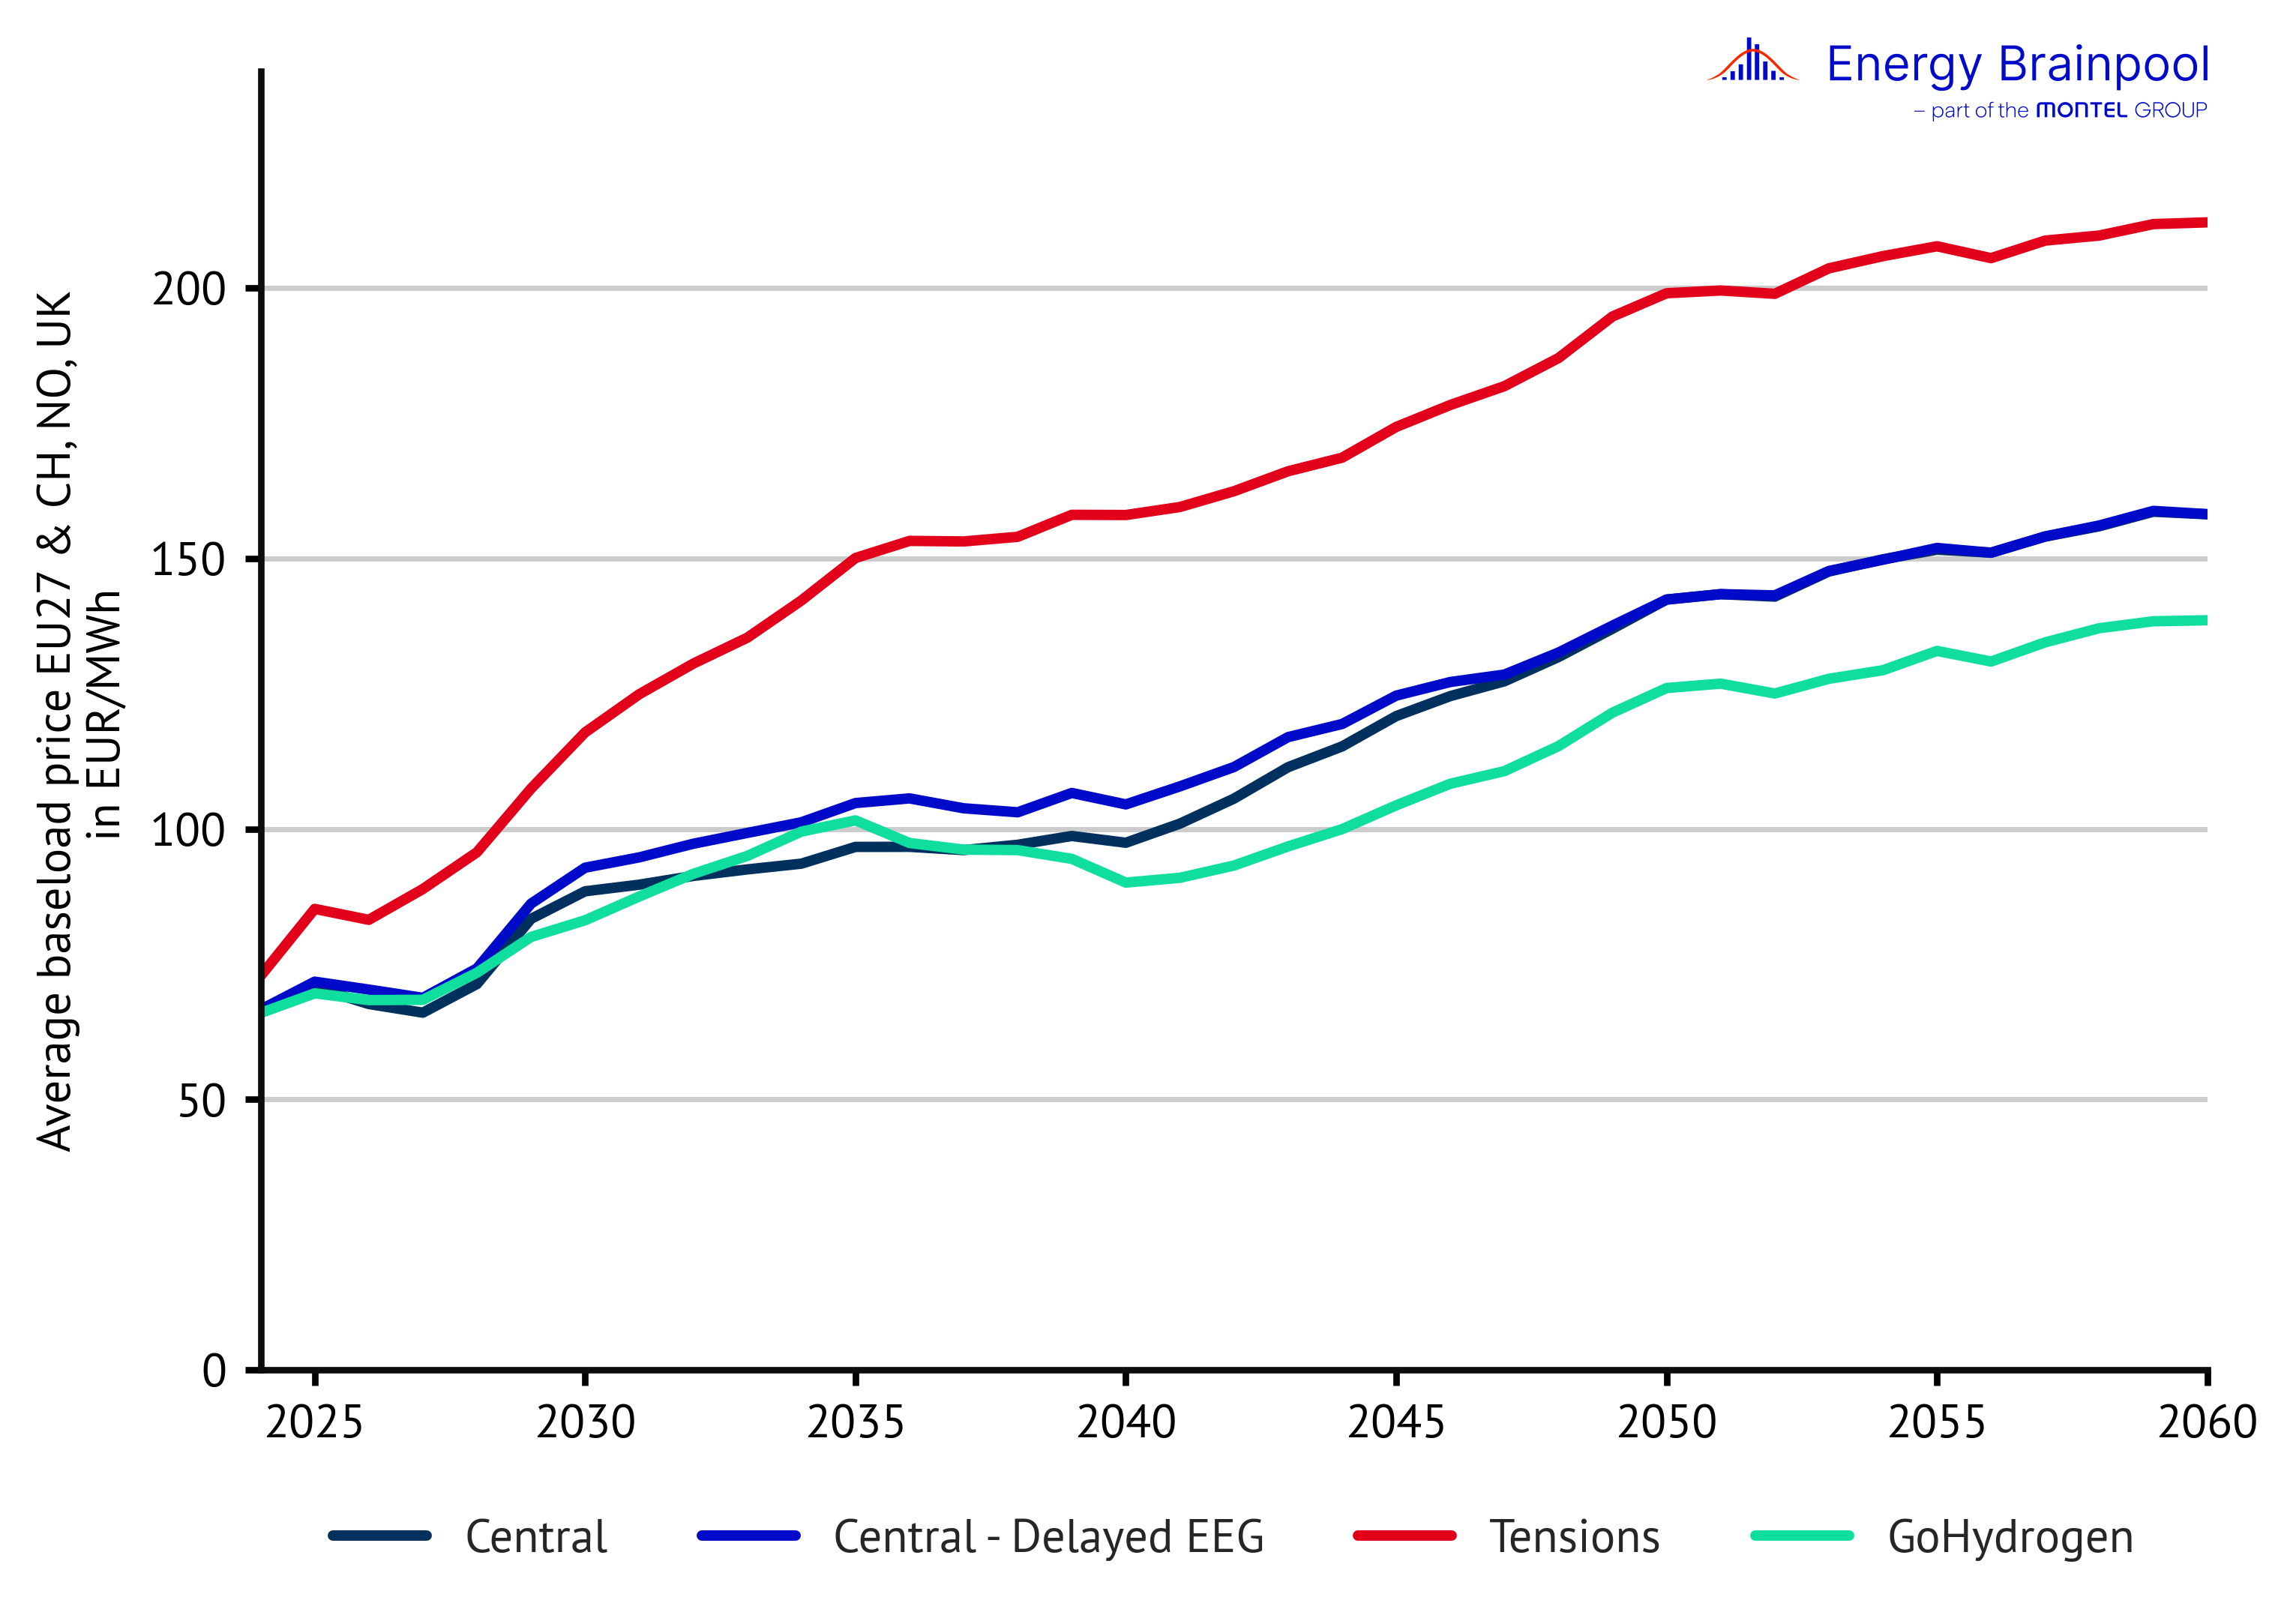
Figure 10: Development of nominal power prices in the respective scenarios (Source: Energy Brainpool, 2024)
However, the average values for 30 countries, which have been examined so far in the analysis of power prices, hide some large deviations between the individual European countries. The fluctuation ranges shown in Figure 11 provide an indication of how wide the range is between different markets. Due to the development of commodity prices in the coming decades, countries with a low expansion of renewable energies in particular will see a more pronounced increase in power prices.
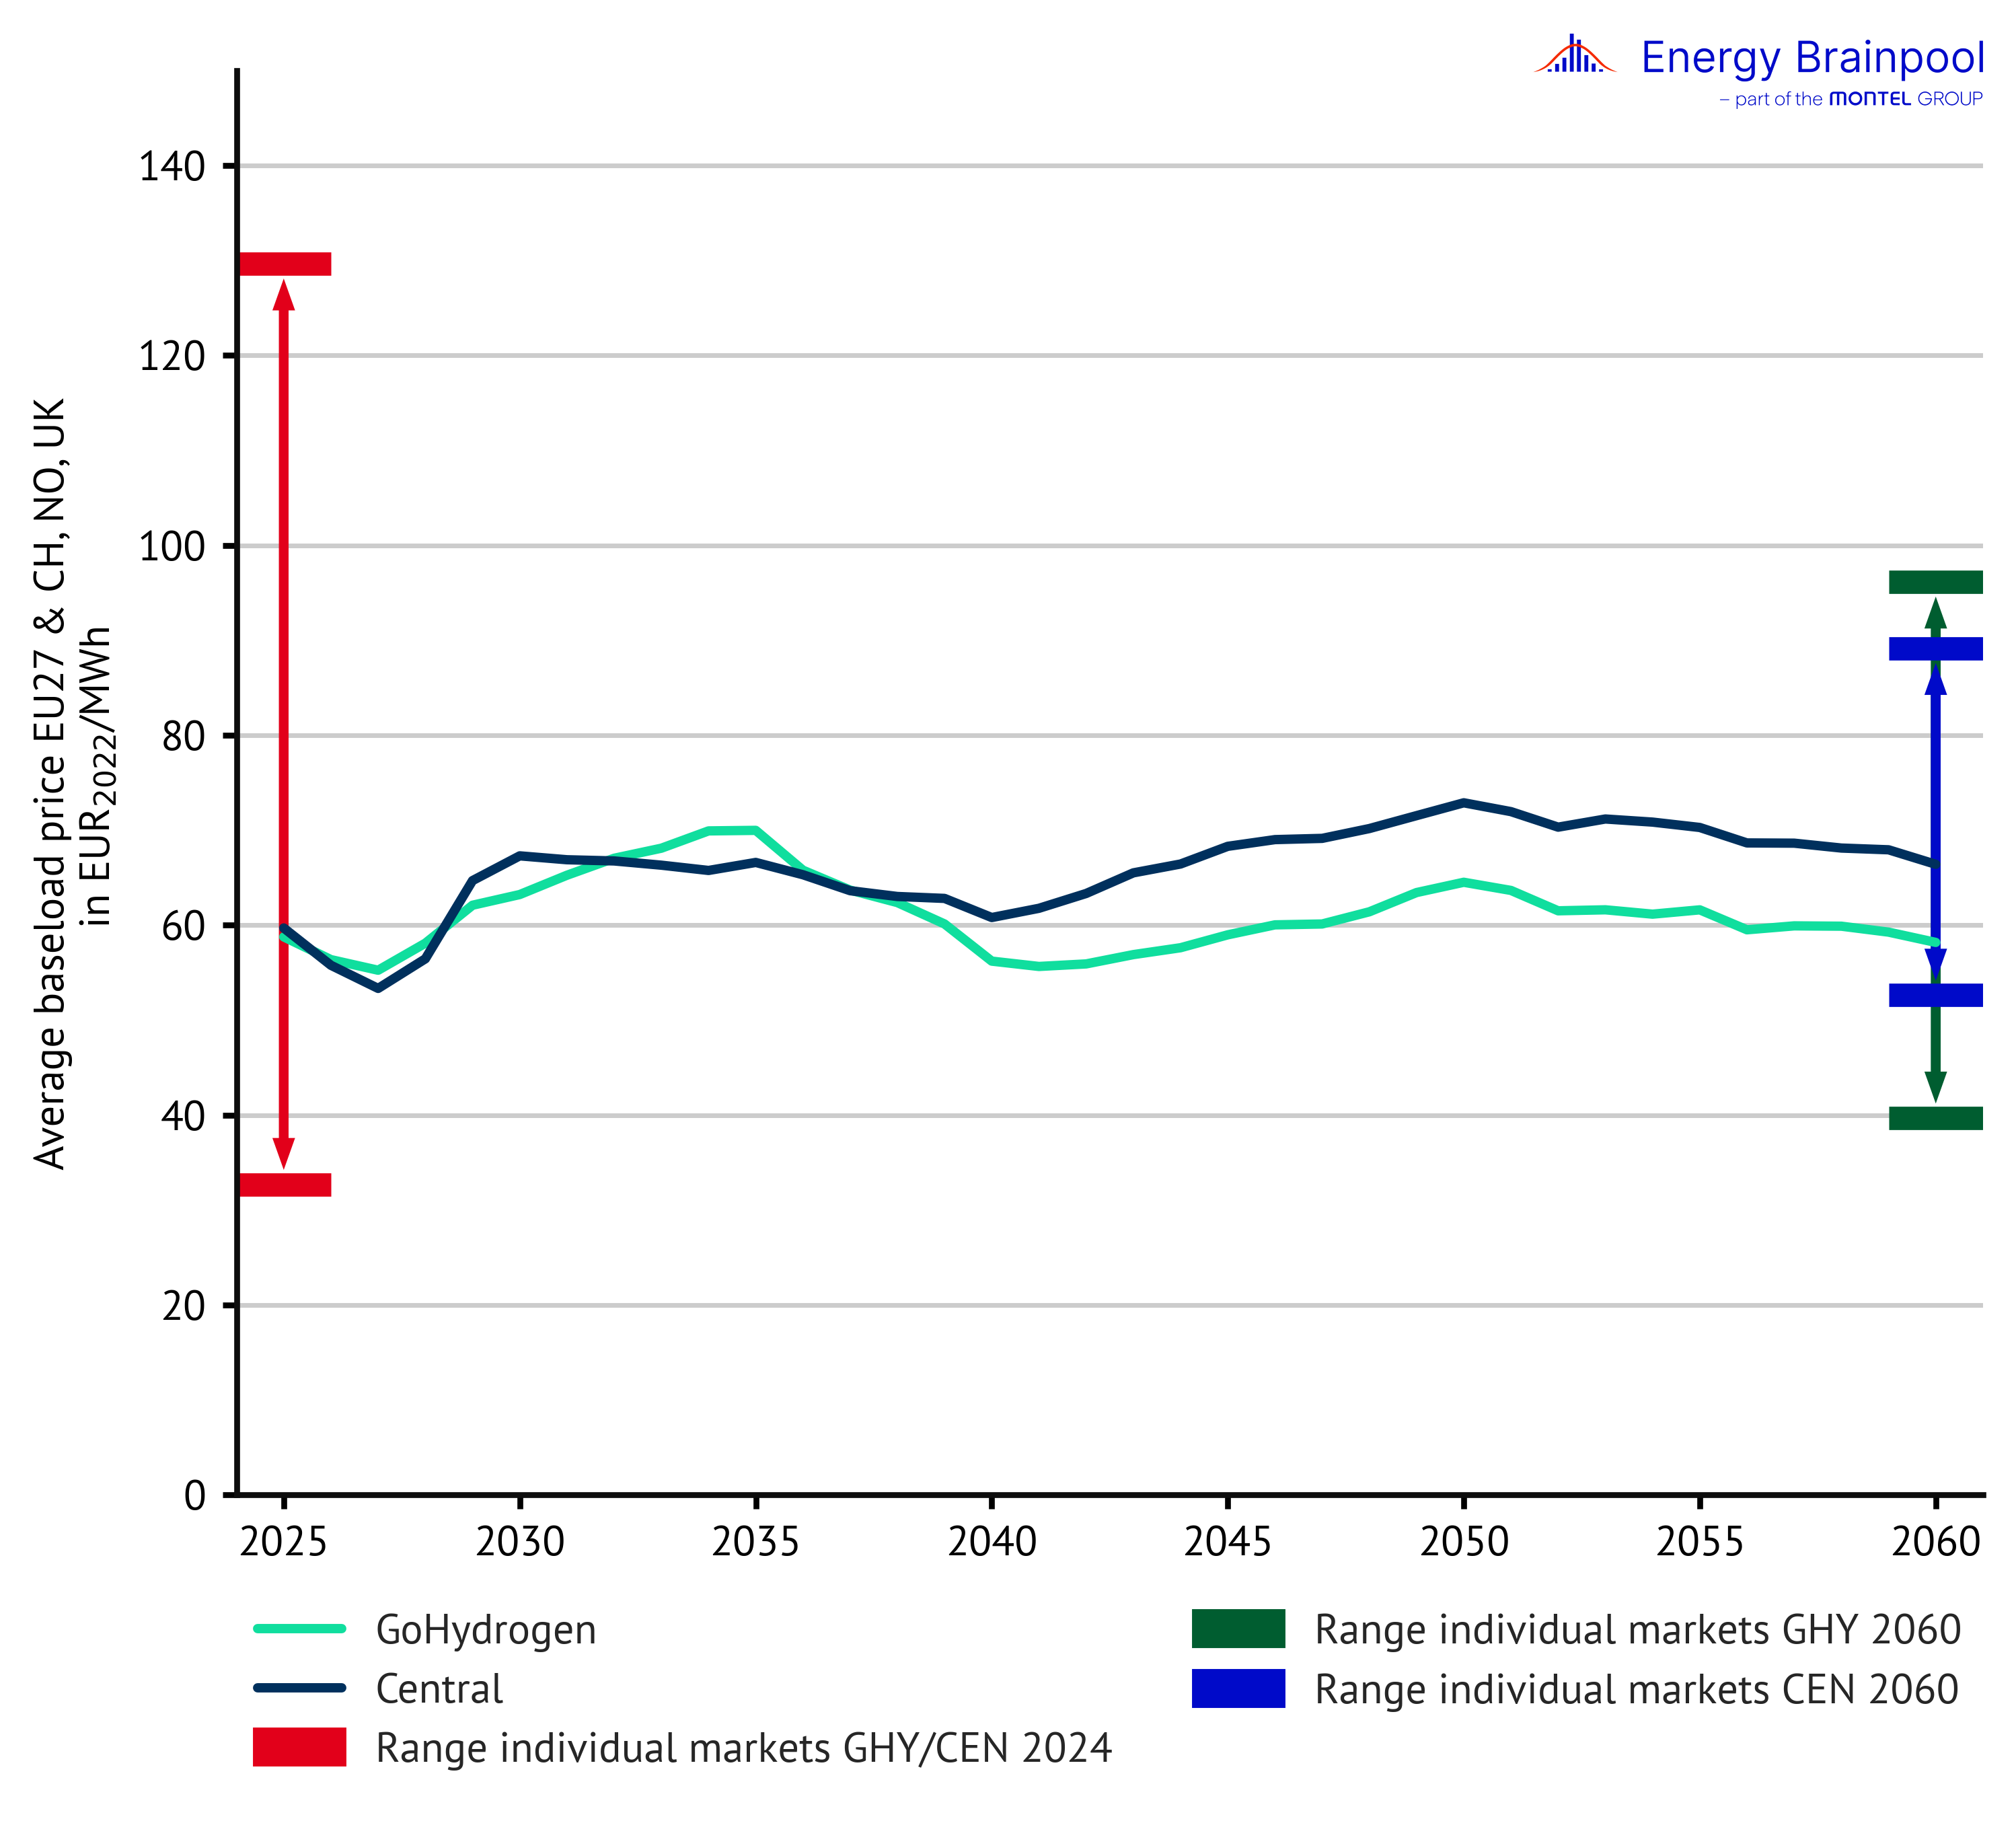
Figure 11: Average annual baseload prices and fluctuation range of individual national markets in selected European countries (Source: Energy Brainpool, 2024)
Analysing power prices on a monthly basis, one will quickly notice that the electricity market follows a dynamic characterised by seasonal fluctuations (see Figure 12). Due to the low temperatures and little sunlight in winter, the analyses show rising prices, whereas power prices are significantly lower in summer. This effect is reinforced by the increasing share of solar power generation.
As a result, seasonal price differences will increase in the future. This dynamic is even more visible in the “GoHydrogen” scenario. This is because a larger generation capacity in solar parks is assumed here. The effect is reinforced by the fact that heat pumps also come more into focus in the “GoHydrogen” scenario as a result of increased electrification. These ensure a higher demand for electricity, especially in winter. This results in a more significant seasonality in this scenario than in the “Central” scenario.
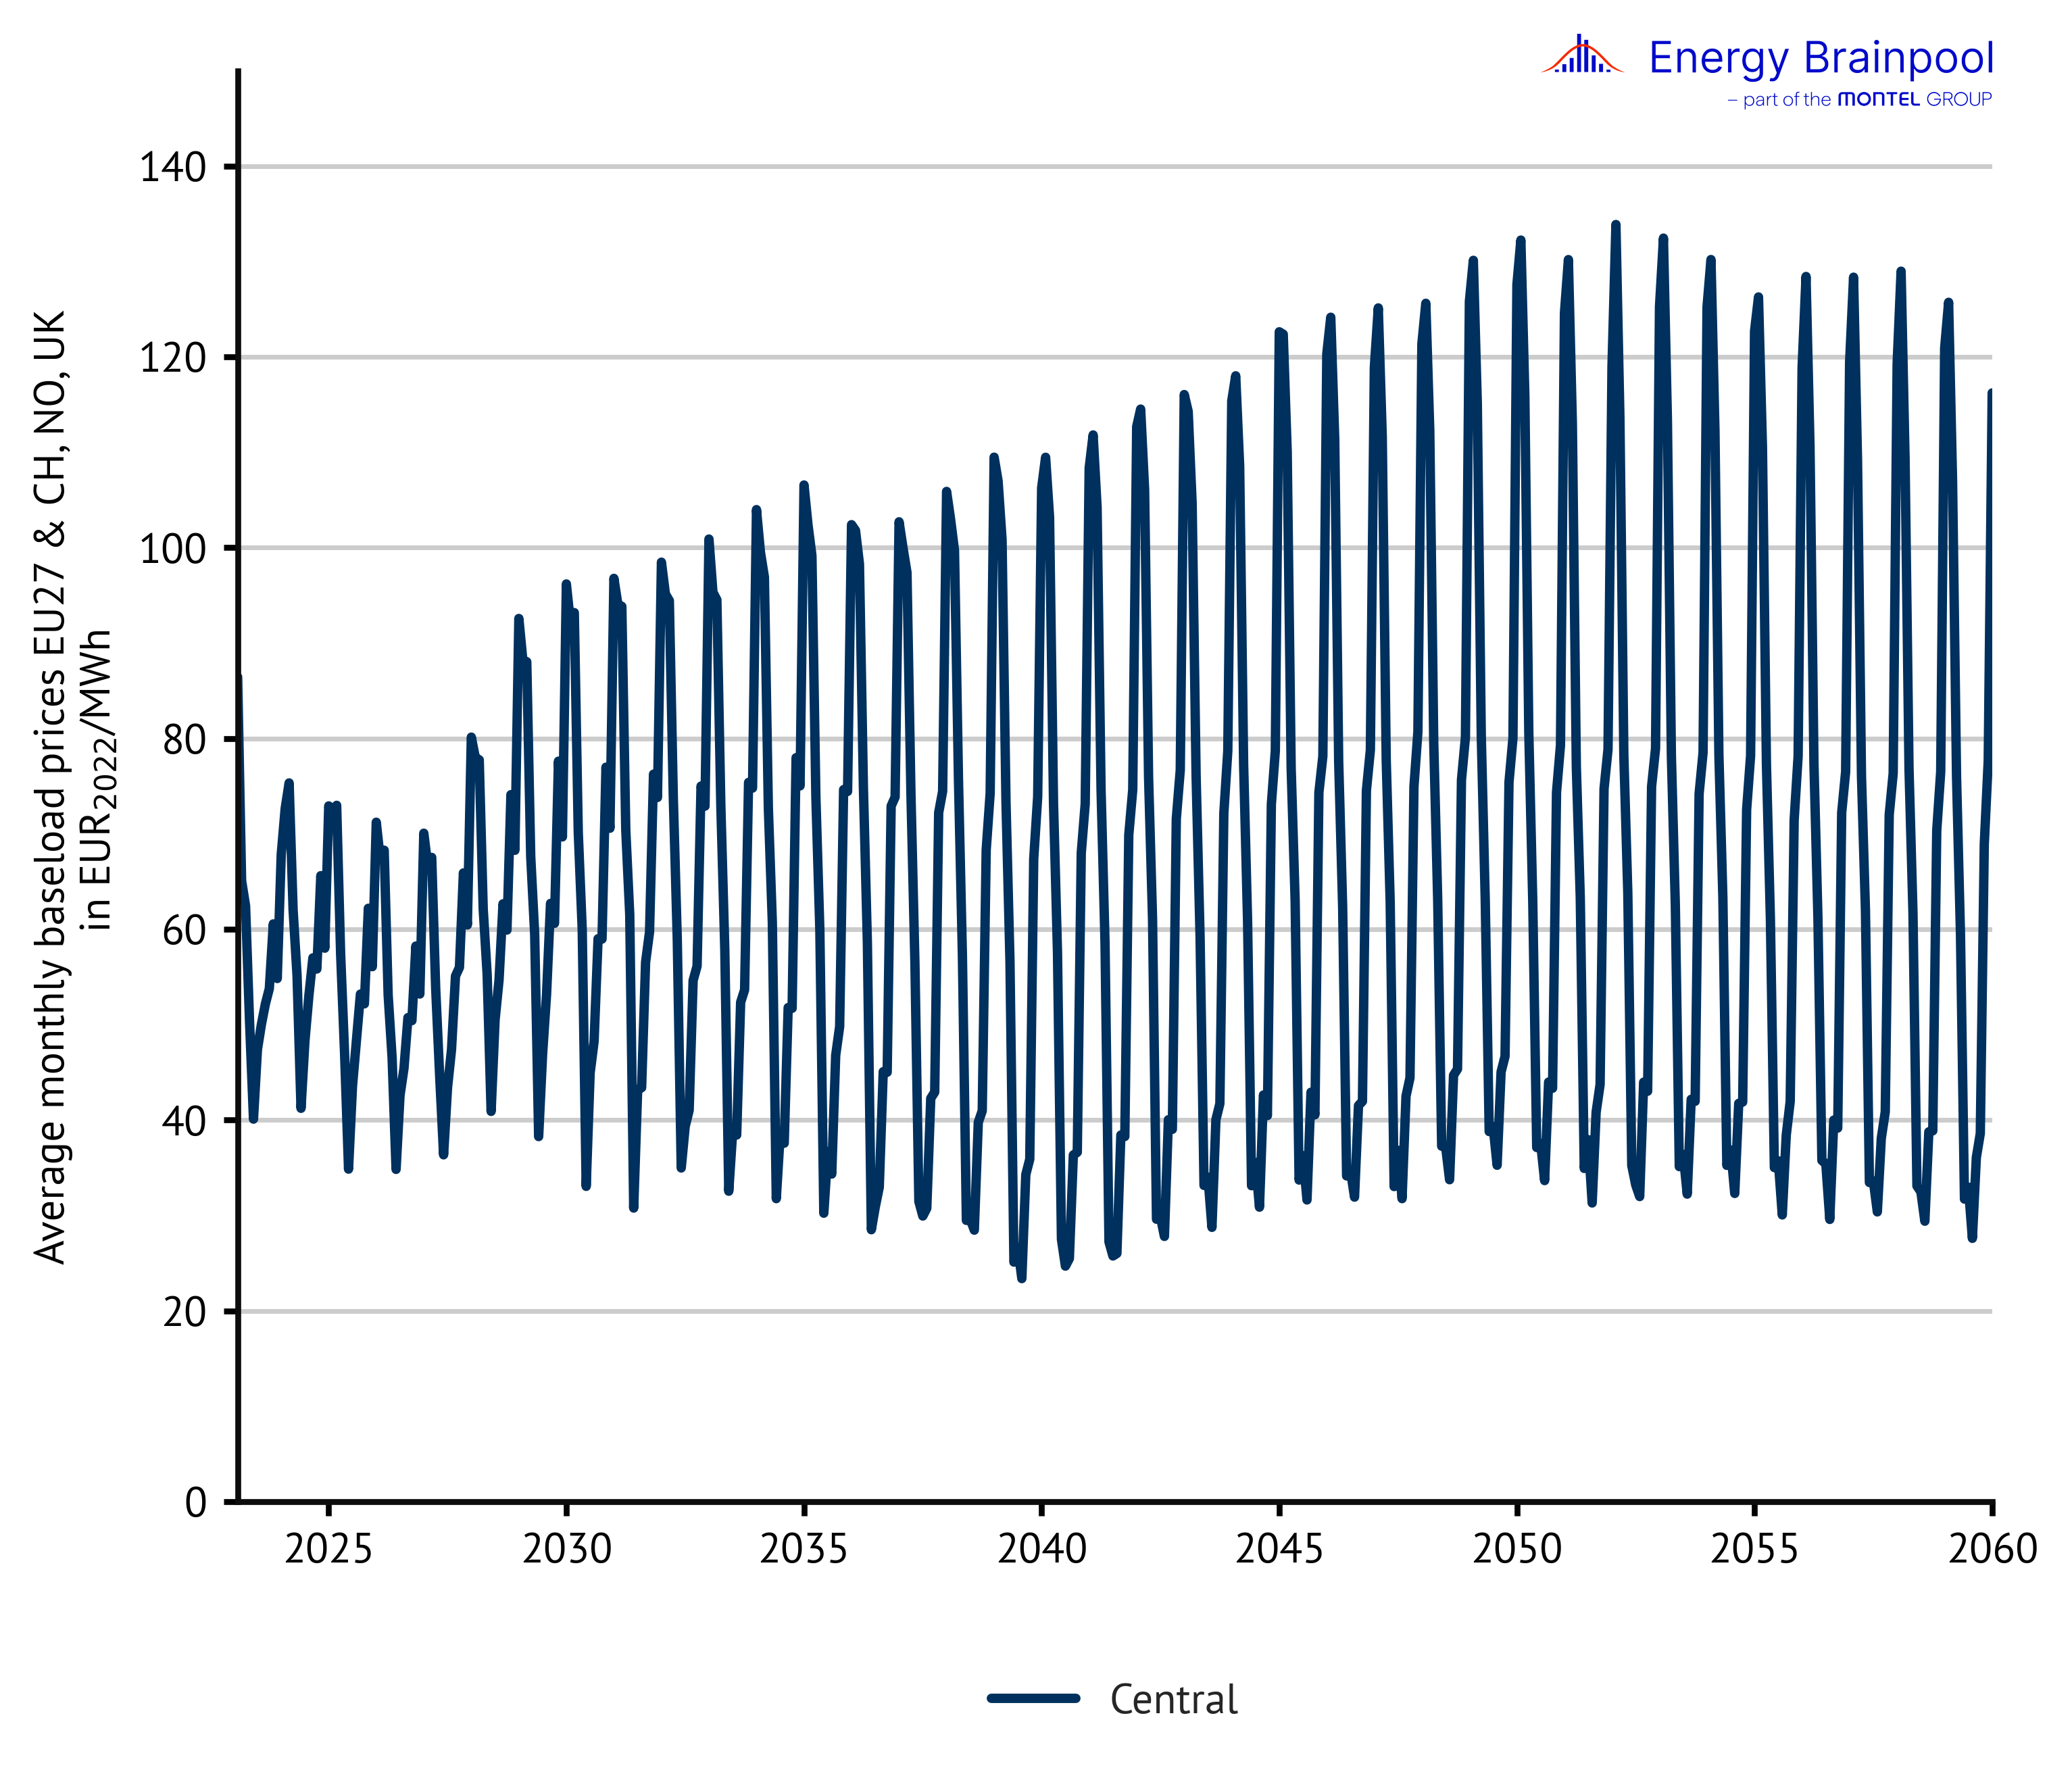
Figure 12: Average monthly baseload prices (Source: Energy Brainpool, 2024)
What revenues are possible for wind turbines?
The average volume-weighted power price that wind and PV systems can achieve on the spot market over the year is one of the most important key figures for renewable energies and is also referred to by experts as the sales value. The calculation is only based on generation hours in which power prices were not negative, but does not exclude the power price of EUR 0/MWh.
The sales volume, on the other hand, represents the share of the electricity generated in these hours compared to the total generation volume. The capture price can be calculated on the basis of these two key figures. This is calculated as the product of the sales value and the sales volume.
The capture price therefore reflects the average annual revenue on the power market for the total generation volume. These key figures are particularly important for renewable energies because they make it possible to evaluate the revenue potential of fluctuating renewable energies on the electricity market.1
Figure 13 shows that capture prices for wind turbines will rise noticeably in the second half of this decade after a slow decline. This price path follows the expected development of baseload prices, which will initially be driven by falling commodity prices and later by rising EUA prices. On a long-term basis, however, increasing capacities are assumed for renewable energy sources in particular.
Simultaneous generation by a higher number of plants reduces power prices in these hours (cannibalisation effect). For the “Central” scenario, this leads to a slow decline in capture prices until 2040. From 2040, there will be a moderate increase again due to the increasing flexible demand for electricity.
In contrast, the “GoHydrogen” scenario shows a sharper decline between 2035 and 2040, before the capture prices level stabilise with slight fluctuations from 2040 onwards. The “GoHydrogen” scenario results in lower prices overall, including capture prices, because capacities grow to a larger extent than in the “Central” scenario due to the increased expansion of renewable power plants.
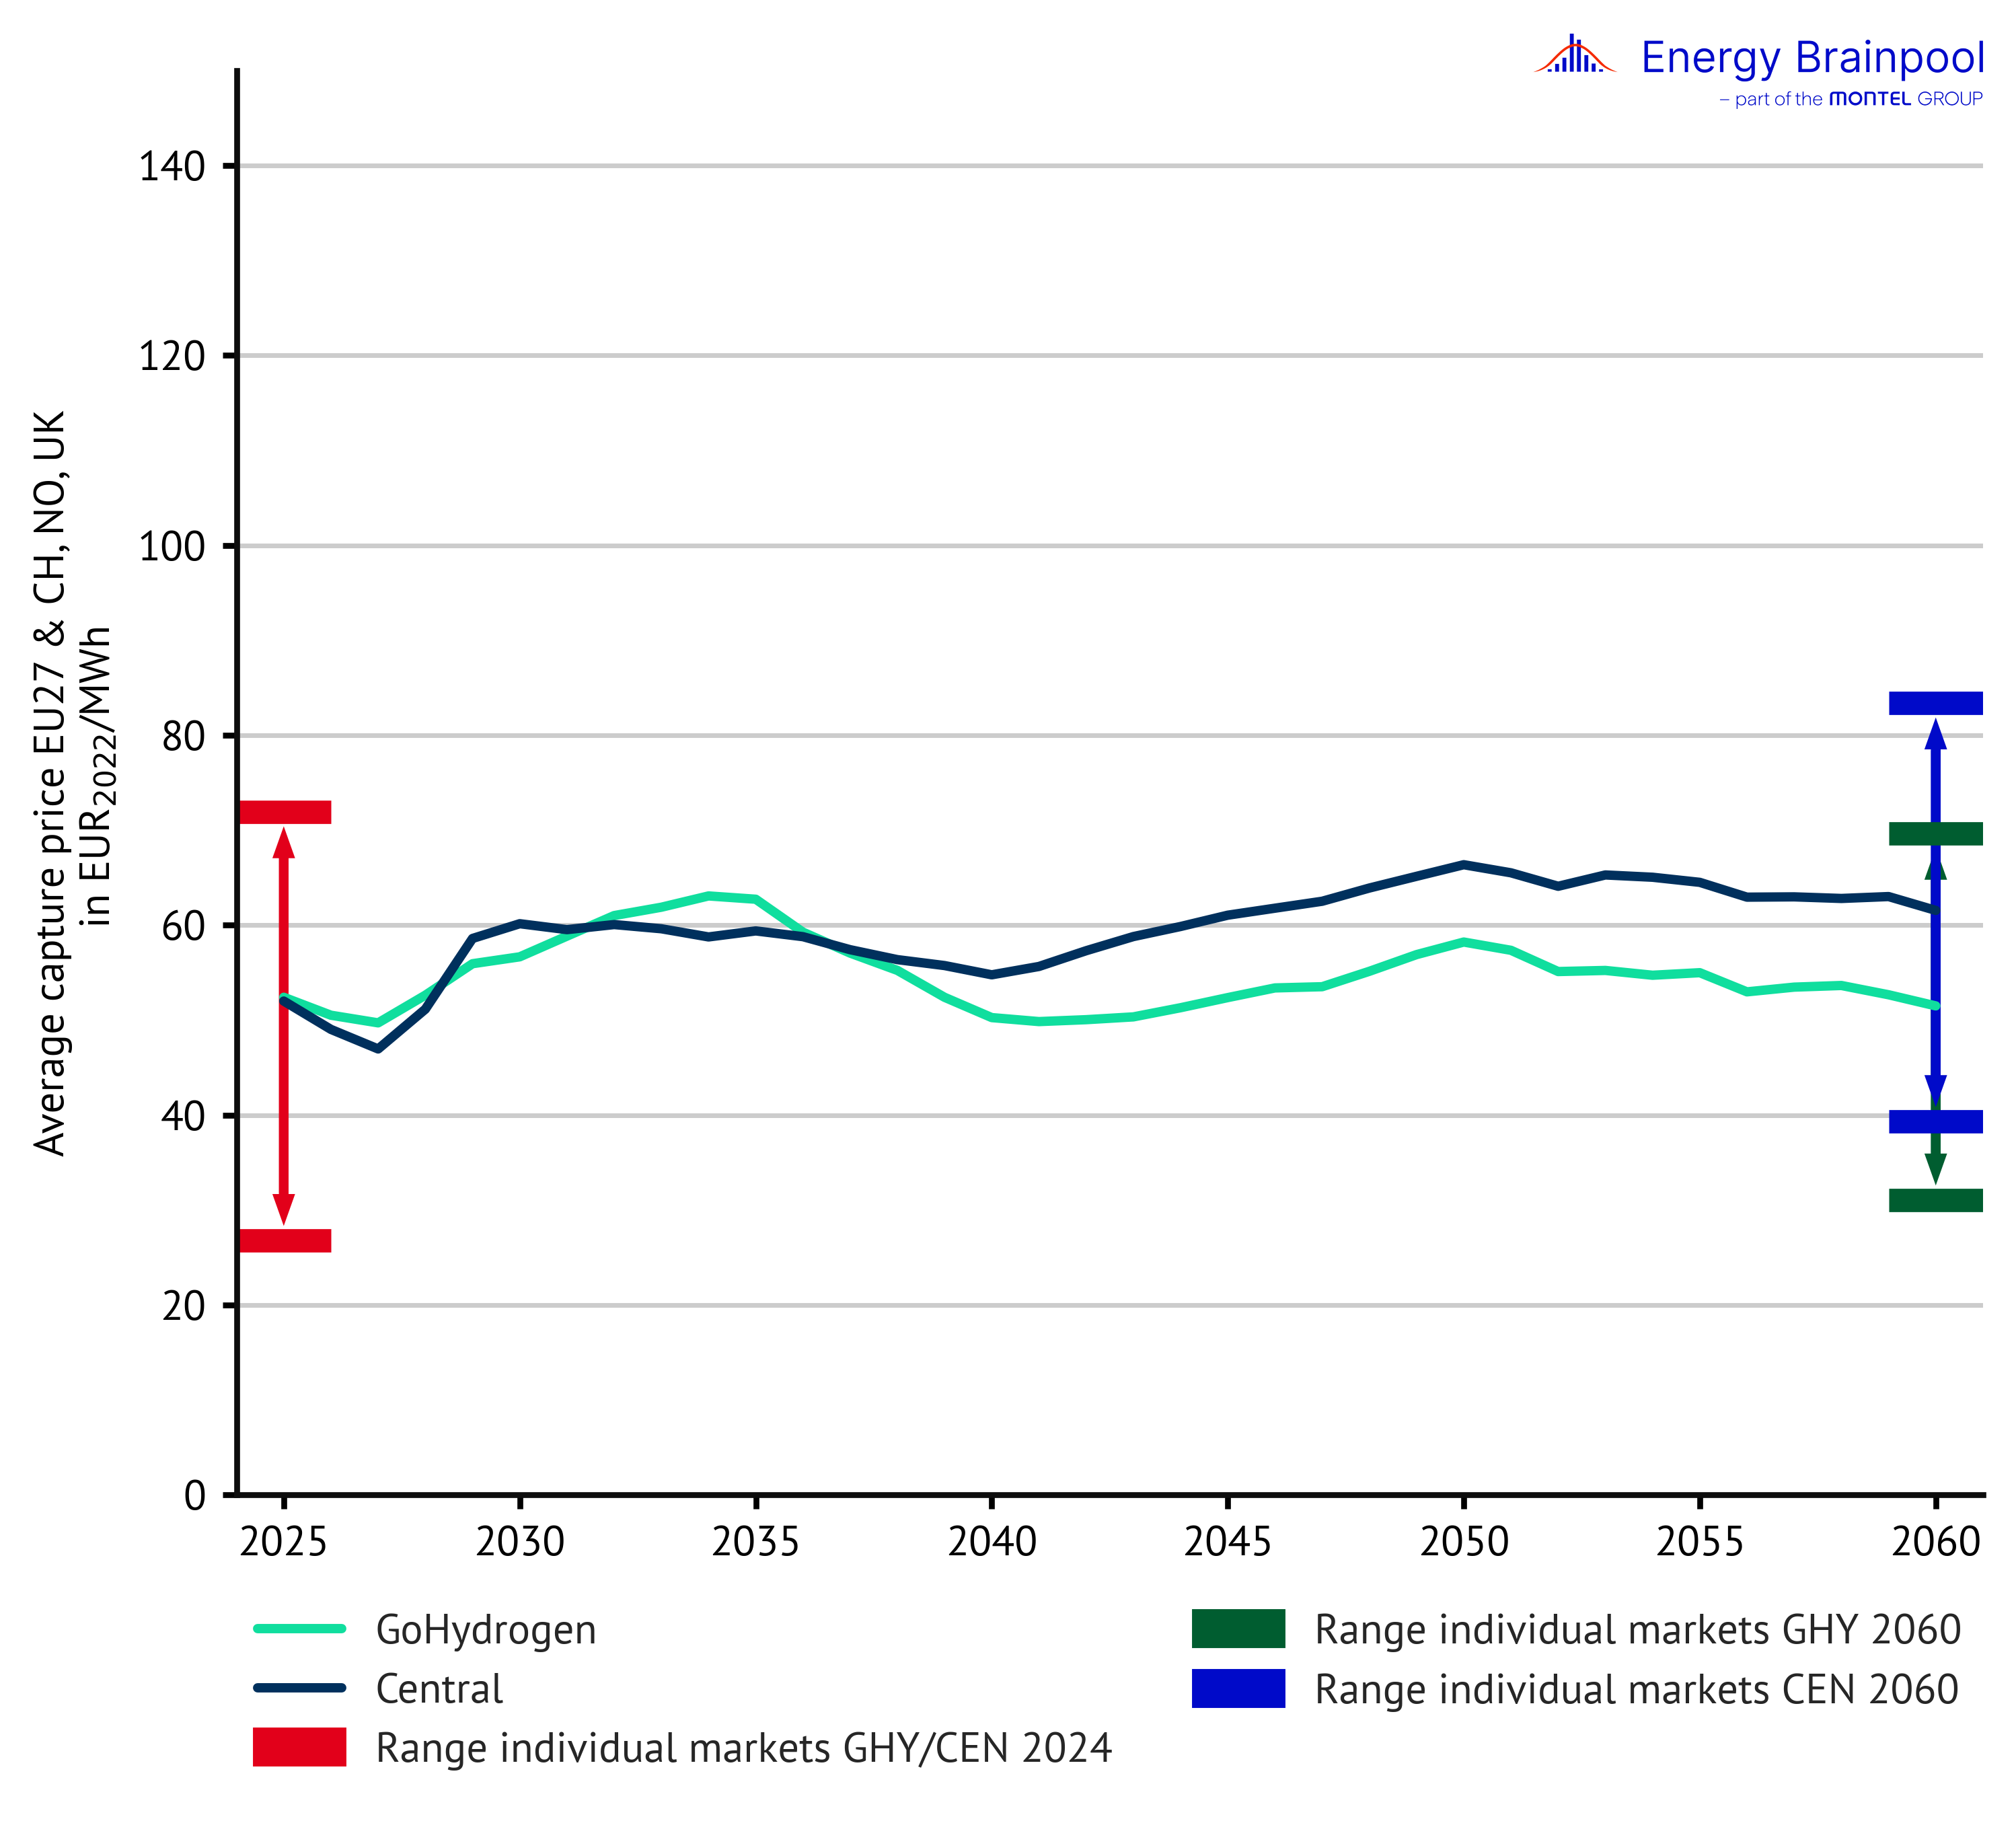
Figure 13: Average capture prices for wind in selected European countries (Source: Energy Brainpool, 2024)
Positive revenues are possible primarily when controllable fossil fuel power plants set the price, even if large capacities of renewables are actively participating in the market at this time. The fluctuation range of the markets gives an indication of how different the country-specific average revenue opportunities for wind turbines in Europe are. This may be due to geographical and economic conditions as well as the progress of the expansion of renewable energies.
What revenues can photovoltaic systems (solar) generate?
Both sales values and capture prices show a steeper downward trend for photovoltaic systems in the “Central” and “GoHydrogen” scenarios than for wind power plants (see Figure 14). This can be explained by the fact that the expansion of photovoltaic capacity in many countries has progressed significantly further than the expansion of wind capacity.
In addition, a strongly pronounced cannibalisation effect can be observed with solar energy, as power prices – and therefore revenues – fall sharply when a lot of solar power is generated, especially on long summer days. The price development in the “GoHydrogen” scenario shows a lower power price due to the higher capacities in wind power. This leads to lower capture prices for solar installations than in the “Central” scenario already in the second half of the 2030s.
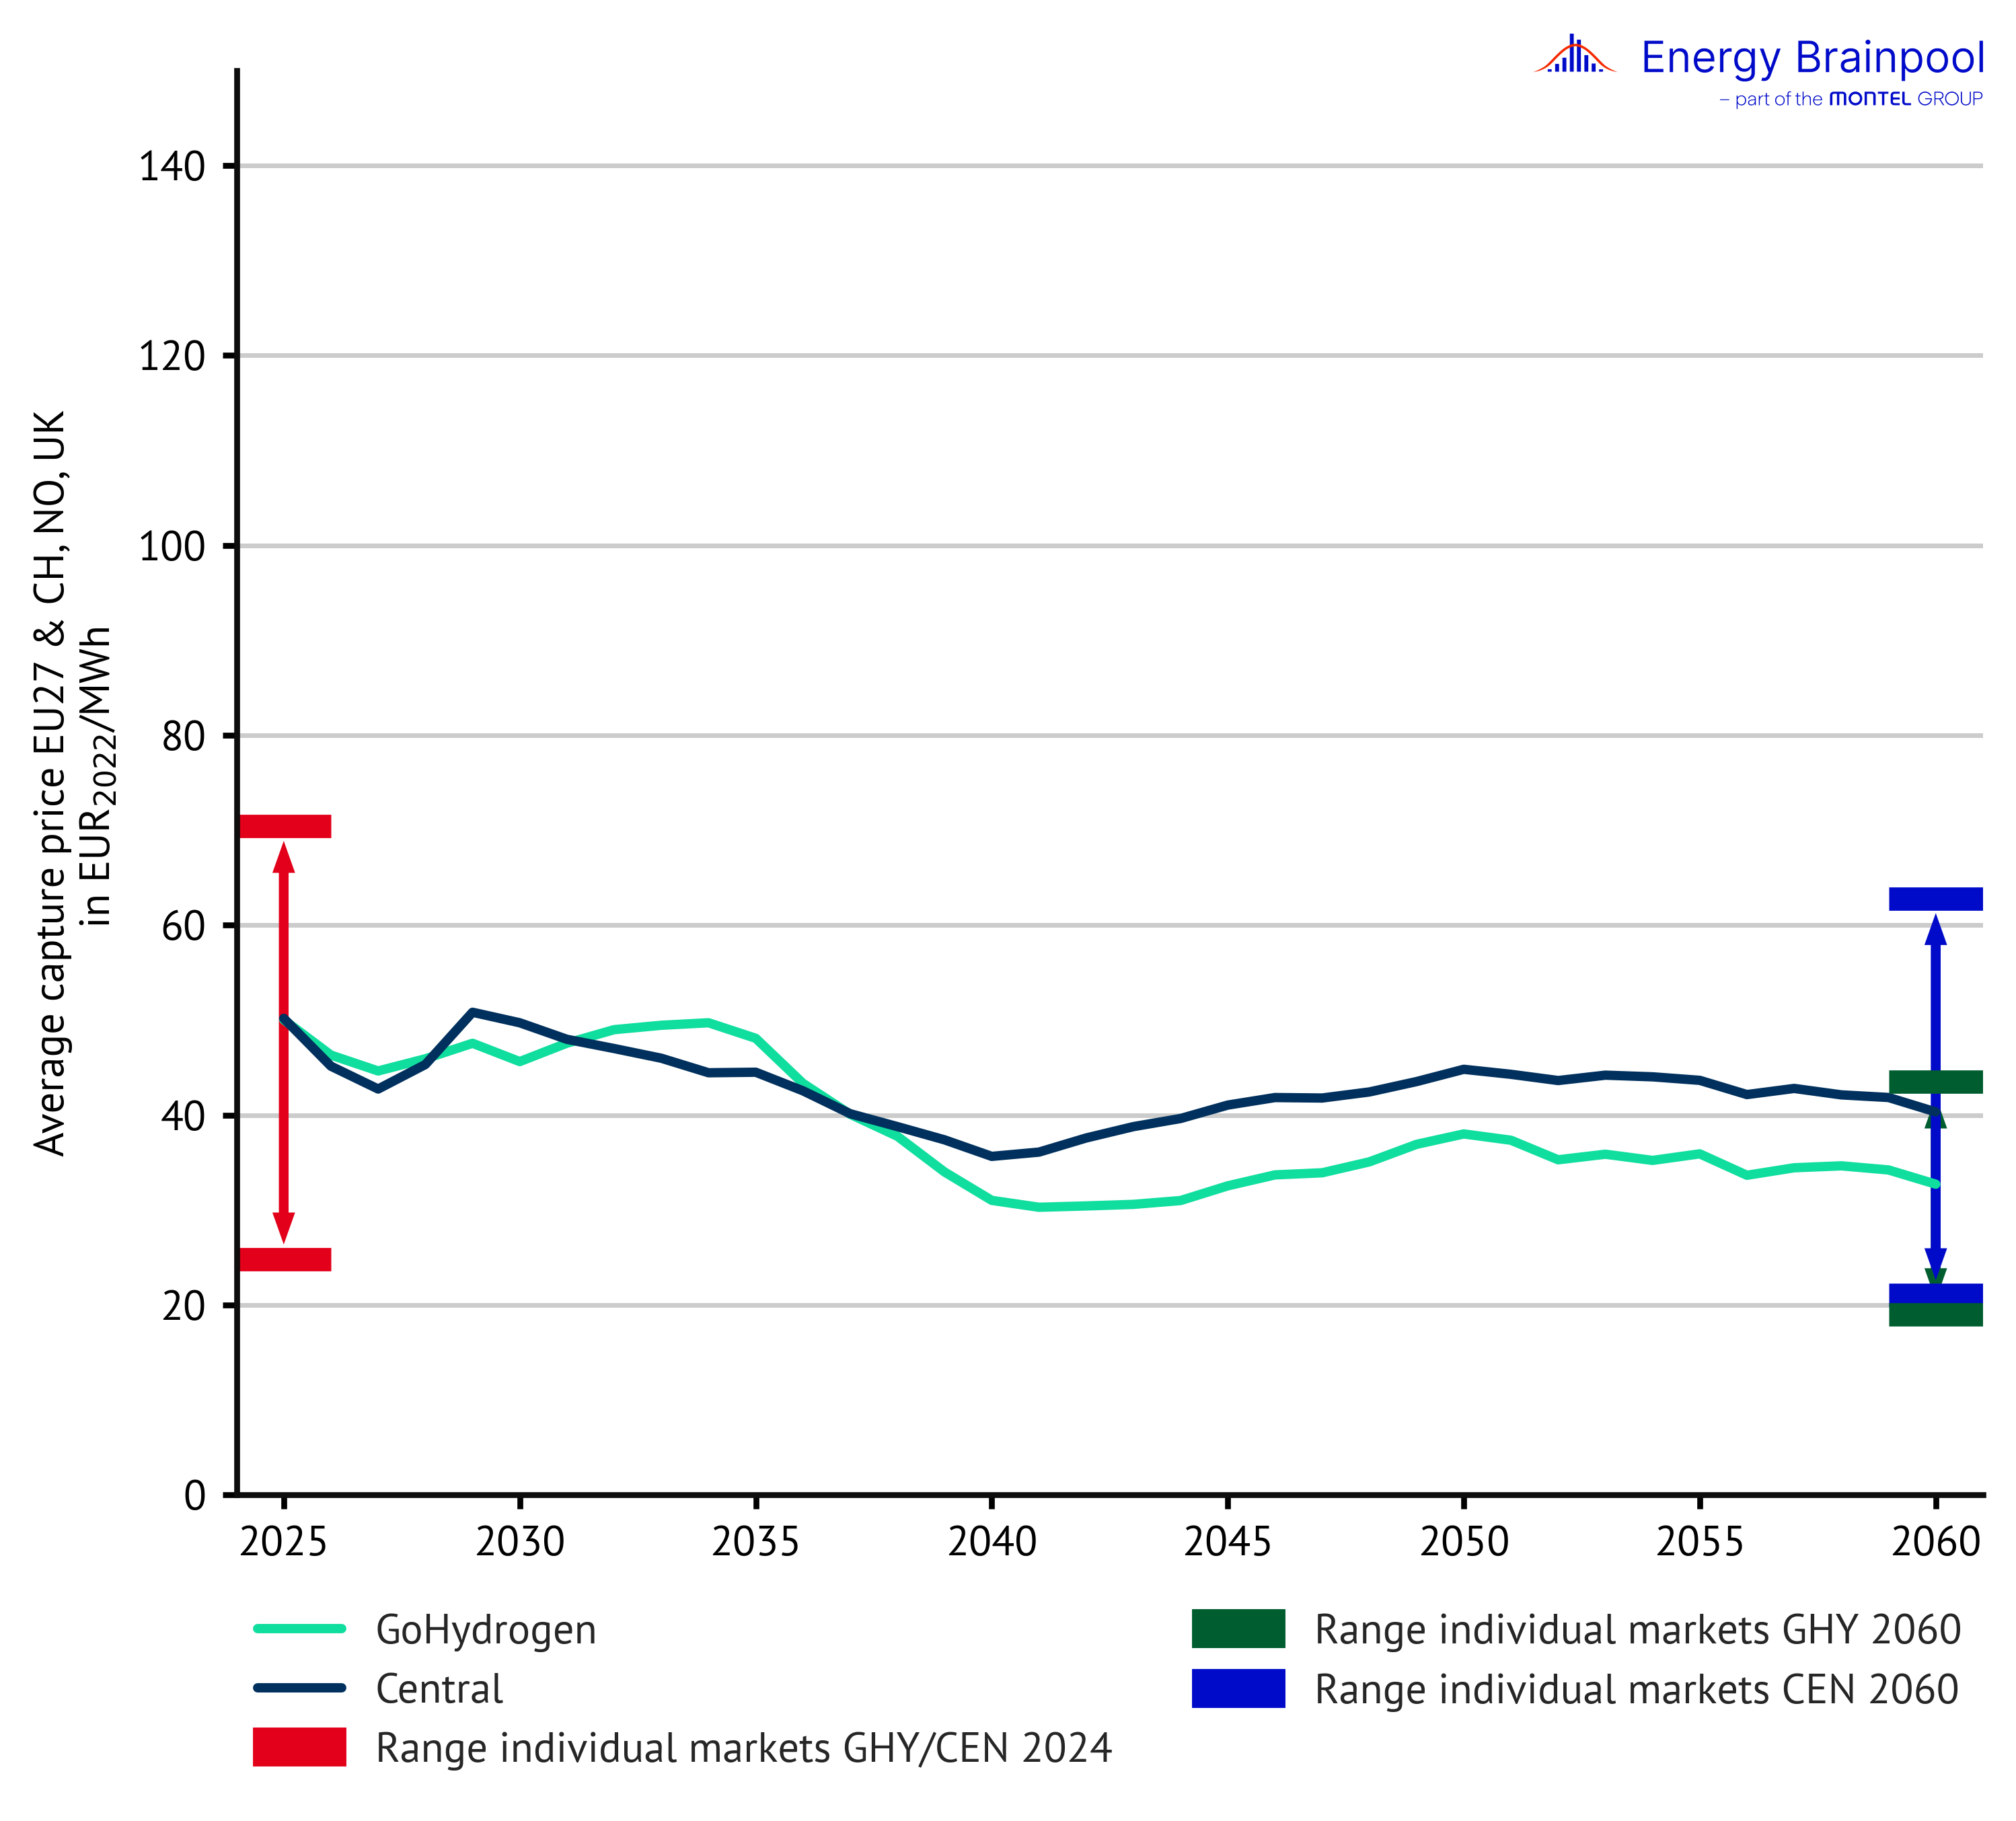
Figure 14: Average capture prices for solar in selected European countries (Source: Energy Brainpool, 2024)
The wide fluctuation range of solar sales values in the individual states shows how much the revenue opportunities will vary. However, the sales value is by no means the only key figure that should be used to assess the profitability of a solar installation. In sunny countries, there is a high capacity utilisation, which can lead to high revenues due to the large volume even with low sales values.
A detailed look at the increase in price volatility
Over the coming decades, a number of market developments in the energy sector are expected to lead to a significant increase in price volatility. Figure 15 shows the price volatility using box plots. These represent the annual baseload prices and the quantiles of the hourly prices in the respective year.
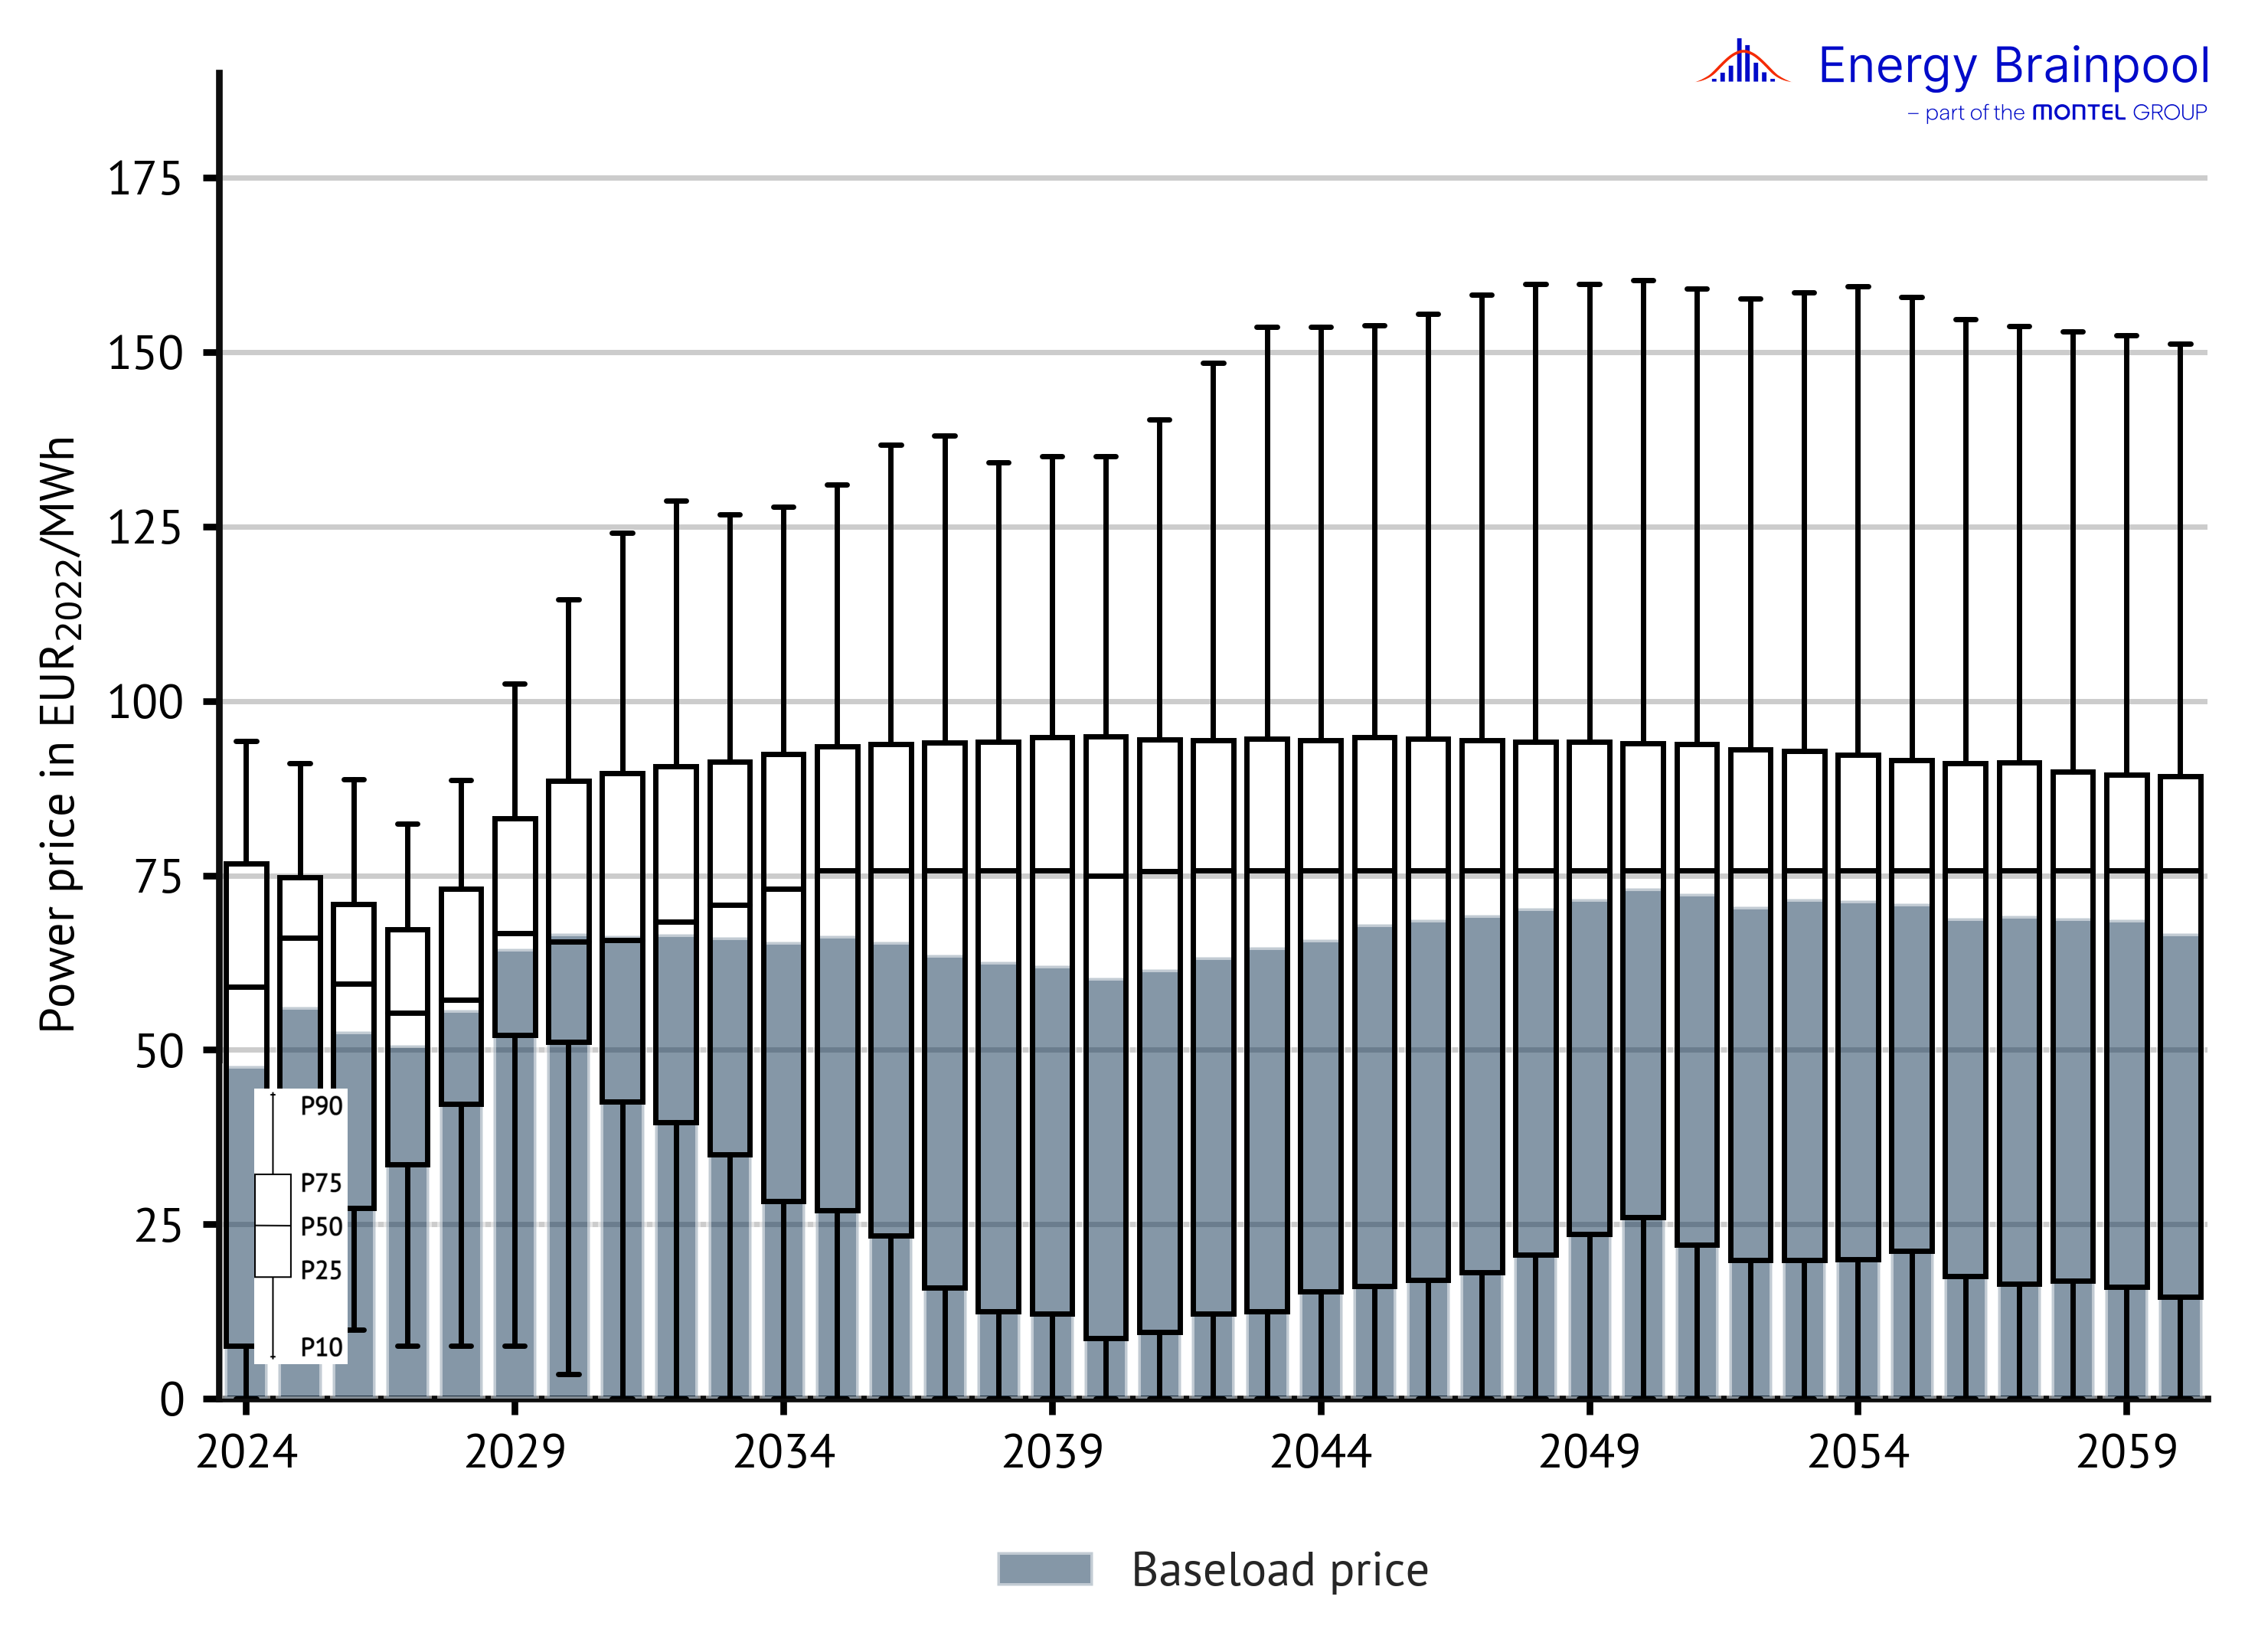
Figure 15: Development of demand-weighted baseload prices and quantiles of hourly prices of selected EU countries in the “Central” scenario (Source: Energy Brainpool, 2024)
With coal power, a fossil fuel with comparatively low LCOE is leaving the merit order. On the other hand, renewable energy sources and controllable H2-capable gas-fired power plants are increasingly becoming two options with few alternatives that are characterised by significantly different LCOE.
Depending on whether the demand for electricity is high or low, either the controllable H2-capable gas-fired power plants or the fluctuating renewable plants will determine the power price.
Extreme prices will therefore occur more frequently in the future and will characterise the power price structure of the day-ahead market. This will increase the revenue potential for storage systems, and battery storage systems in particular will become increasingly attractive economically.2 These fluctuations occur more frequently and to a greater extent in the “GoHydrogen” scenario than in the “Central” scenario.
Authors: Elena Dahlem, Huangluolun Zhou, Dr. Alex Schmitt
[1] EU, 2021: EU reference scenario 2020: Energy, transport and GHG emissions – trends to 2050 [online] https://op.europa.eu/en/publication-detail/-/publication/96c2ca82-e85e-11eb-93a8-01aa75ed71a1/language-en/format-PDF/source-219903975 [Accessed: 07.04.2024].
[2] IEA, 2023: World Energy Outlook [online] https://iea.blob.core.windows.net/assets/66b8f989-971c-4a8d-82b0-4735834de594/WorldEnergyOutlook2023.pdf [Accessed: 07.04.2024].
[3] entso-e, 2024 [online] https://tyndp.entsoe.eu/ [Accessed: 07.04.2024].
[4] US Office of Fossil Energy and Carbon Management, 2023 [online] https://www.energy.gov/fecm/listings/lng-reports [Accessed: 07.04.2024].
1 See White Paper „Valuation of Fluctuating Renewable Energy“.
2 See the blog article “Revenue Potential for Battery Storage Systems on the Power Market – Current Developments“.
What do you say on this subject? Discuss with us!