


As a customer, it is interesting to know how well power price scenarios perform compared to the historical development of spot prices.
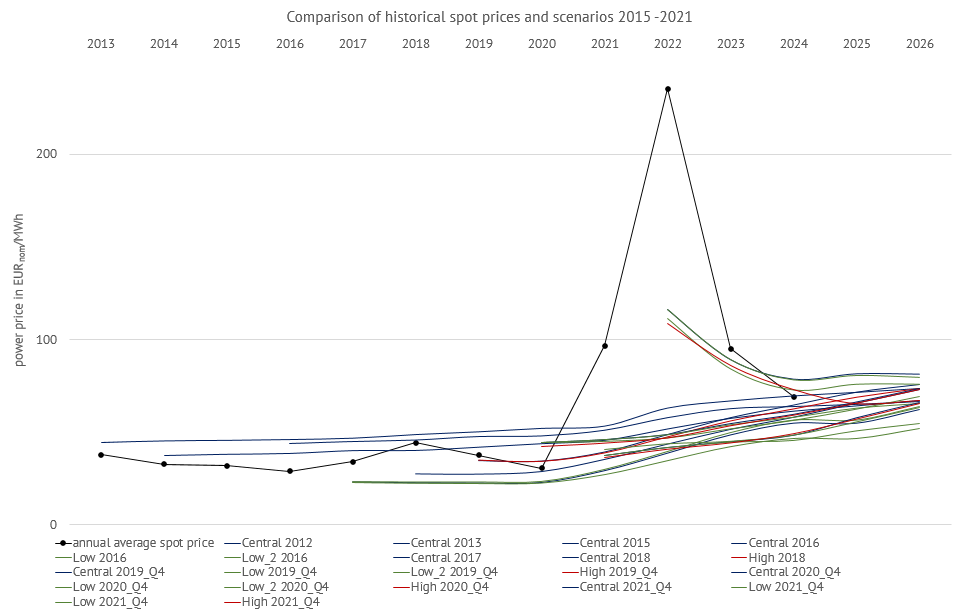
Here you can see a comparison of historical spot prices (annual average) with the power price scenarios (annual values) published by Energy Brainpool for Germany since 2013:
In order to interpret the comparison correctly, there are a few points to consider: To calibrate our energy market model Power2Sim, we use current commodity prices to predict the next three years and compare whether our results match the current futures market prices on the electricity market.
The futures market price is a volatile expectation of the spot price in the future and changes over time. A representation of a reference date value must inevitably deviate from the price development over time. This is because short-term fluctuations in weather, commodity prices, demand and production cannot be taken into account.
In the period 2013–2016, the trends in our power price scenarios therefore reflect the respective futures market prices and were higher than the actual spot prices. Since 2016, we have therefore been publishing several consistent development scenarios as a what-if analysis in order to show a range of possible solutions.
The various paths are based on today’s knowledge, but they must not be understood as a forecasts. This applies in particular to the liquid trading period (3 to 5 years into the future). If we look at the historical spot prices since 2017, we can see that these were actually within the modelled price corridor and that the low price scenarios were not undercut even during the coronavirus pandemic.
Only the extreme price peaks caused by the Russia-Ukraine conflict, which cannot be explained in fundamental terms, significantly exceeded the values of the power price scenarios.
However, they are once again within the corridor which are covered by our different scenarios. It is also clearly visible how the futures market had already taken into account the developments and risks at that time in the fourth quarter of 2021, meaning that the values of our power price scenarios for 2022 were already significantly higher.
Conclusion: The chart shows that the historical prices lie within the solution space opened up by Energy Brainpool’s power price scenarios. The extreme prices caused by the attack on Ukraine are an exception.
What do you say on this subject? Discuss with us!