


The electricity price, be it at the futures or the spot market, depends on several factors. Those include the (expected) demand, the available power plants (renewable and conventional) and the short-term fuel costs of the power plants used. The power plants along the upper part of the merit-order have the greatest influence on the electricity price, because they are needed to just meet demand. Generally, hard coal or gas-fired power plants are price-setting.
Therefore the correlation of gas, hard coal and CO2-prices with the electricity price is an interesting indicator for the energy sector. In the following this correlation is examined in detail.
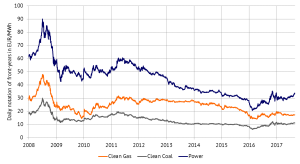
For the analysis future prices of the respective front-year contract for electricity [1], gas [2], hard coal [3] and CO2 [4] starting from 2008 have been taken into account. The fuel and CO2-prices have been converted into ”Clean Coal“ and ”Clean Gas“. As a combination of fuel costs and specific CO2-costs [5] of the respective energy carrier, these two figures reflect the short-term marginal costs of average power plants at the future markets. Figure 1 depicts the course of those figures from 2008. Basically, electricity prices and (clean) fuel costs show a similar development. The price development of Clean Coal and Clean Gas is however not running in parallel. When just looking at fuel costs, without CO2-costs, a similar effect can be recognised. The price advantage of Clean Coal compared to Clean Gas varies from 2 to 20 EUR/MWh (compare figure 2).
")
Figure 1: Daily notations for electricity, Clean Gas and Clean Coal (front-year). Source: Energy Brainpool
")
Figure 2: Comparison of Clean fuel costs (Hard coal and gas). Source: Energy Brainpool
It is important to determine with which of the two fuel cost price paths, the electricity price follows more significantly. Figure 3 illustrates the correlation between Clean Coal and Clean Gas, respectively, to electricity prices. The depicted coefficient of determination [6] is a measure for the linear relationship: a value of 1 denotes a perfect linear relationship. From figure 3 it can be deducted that the electricity price is determined by the Clean Coal-price by 93 per cent, while the Clean Gas-price only shows a coefficient of determination of 62 per cent. On a monthly basis (not depicted here) it is also obvious that the correlation between the electricity price and Clean Coal is generally higher than with Clean Gas. Especially, the correlation of Clean Coal and electricity price seldom drops below 50 per cent, while the correlation with Clan gas frequently lies below 50 per cent and even below 5 per cent. In consequence, the electricity price has very little or almost no relationship to the generation costs of a gas-fired power plant.
For a more recent evaluation (Figure 4, from 2016 onwards), the correlation6 with Clean Coal is permanently high, whereas the correlation with Clean Gas regularly does not exist at all.
 (2008-2016), source: Energy Brainpool")
Figure 3: Correlation between Clean Coal and Clean Gas with the electricity price (daily notations) (2008-2016), source: Energy Brainpool

Figure 4: Coefficient of determination between Clean Coal/Clean Gas and electricity price on a rolling basis, source: Energy Brainpool
For electricity trades this has relevance, as the development of (futures) exchange prices for electricity react much more sensitive to developments on the hard coal market compared to developments on the gas market. The influence of the CO2-price (even though at a low level) should not be underestimated: The correlation between mere hard coal price and the electricity price is always lower than the one with Clean Coal (hard coal plus CO2-price).
For operators of hard coal-fired power plants this high correlation also exemplifies a significant relationship between the electricity price and the Clean Dark Spread, i.e. the contribution margin 1[7]. This relationship however weakens with lower efficiencies of the power plant in question, as figure 5 shows. The correlation between Clean Gas and electricity prices is already quite low and highly volatile. Therefore the correlation between electricity price and Clean Spark Spread, i.e. the contribution margin 1[7] for gas-fired power plants is very low as well (cf. Figure 6).
Operators of gas-fired power plants, as well as of hard coal power plants with low efficiencies the electricity price as such does not provide a clear statement in terms of profitability of the respective power plant. For gas power plants – where this correlation is as low as 12 to 0 per cent – it even has to be asserted that the electricity price does not provide a tendency for the profitability of the power plant at all. Specifically, the high electricity prices of 60 to 80 EUR/MWh as depicted in Figure 6, did not necessarily lead to positive Clean Dark Spreads. During this period in the years of 2008 and 2009, high electricity prices were primarily a result of high commodity prices and therefore also increasing generation costs of gas-fired power plants.
, source: Energy Brainpool")
Figure 5: Correlation between electricity price and Clean Dark Spread (2008-2016), source: Energy Brainpool
, spurce: Energy Brainpool")
Figure 6: Correlation between electricity price and Clean Spark Spread (2008-2016), source: Energy Brainpool
What’s the take-away for the future? The nuclear phase-out in Germany until 2022 will lead to a shortened merit-order of the conventional power plant. Depending on the expansion of renewables, the frequency of use of gas-fired power plants, which might then move down the merit-order, could increase. Eventually, the effect of Clean Gas on electricity prices might be enhanced. The political and societal discussion on a coal phase-out would even accelerate this phenomenon.
[1] EEX, Base, market area D/AT
[2] TTF
[3] API2, converted from US-$ into EUR on the basis of corresponding exchange rates at a certain time
[4] EEX, EUA MidDec
[5] Conversion factor for CO2-prices: Gas: 0,2 t/MWh th; Hard coal: 0,34 t/MWh th
[6] here: 30 days on a rolling basis, formula: Coefficient of determination

Coefficient of determination
[7] Contribution margin 1 = Income by selling electricity – Fuel costs (incl. CO2) / Efficiency