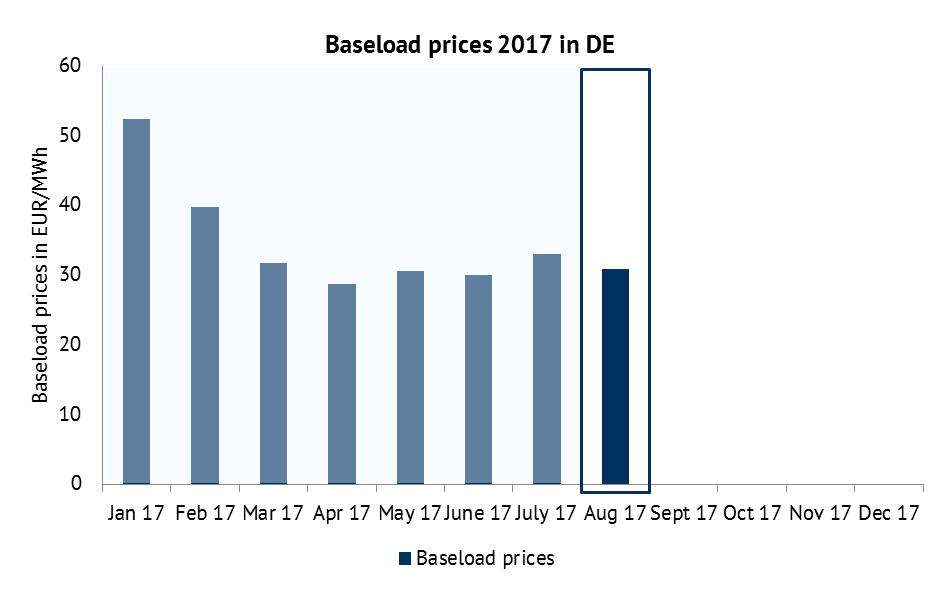
Despite a slight decline in the production of variable renewable energies sources (vRES) of around 3 per cent, the baseload price in Germany fell by around 2.2 EUR/MWh in August 2017 compared to the previous month. The reason for this was…
…the low electricity demand caused by the summer break in August. Historically, the month August has the lowest electricity demand of the year. As a result of the decline in baseload prices, the sales values for vRES also fell compared to the previous month.
Development of sales values in 2017
The sales values represent the weighted average vRES market revenue. In the white paper “Valuation of revenues of fluctuating renewable energy sources” the key performance indicators of the revenues of non-promoted vRES are explicitly defined.
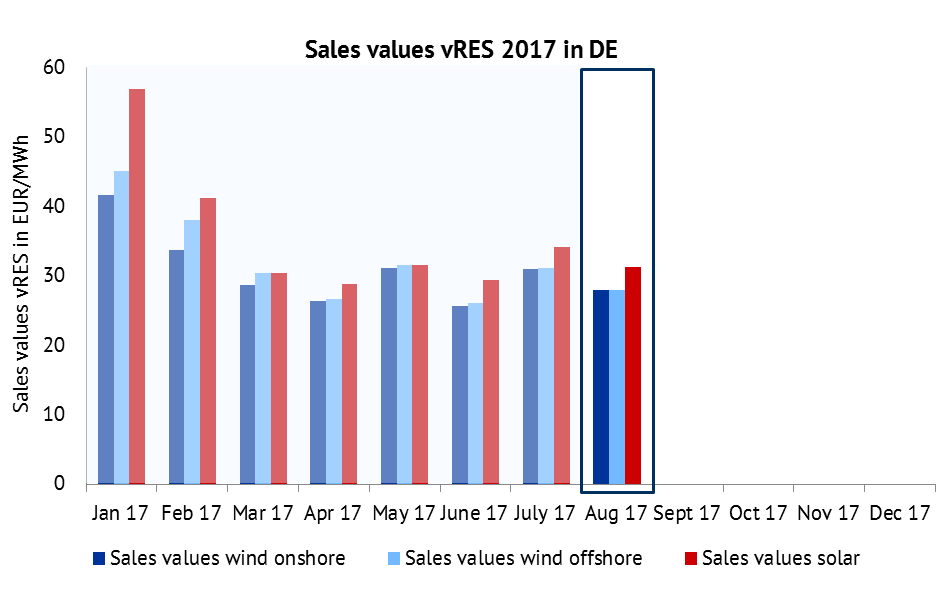
Figure 1: Sales values for wind onshore, wind offshore, PV in EUR/MWh. Source: Energy Brainpool, EPEX Spot, ENTSO-E Transparency
In August 2017, sales values declined by ten per cent compared to the previous month. For solar, on- and offshore-wind power plants, this meant about 3 EUR/MWh lower revenues for non-promoted direct marketing than in the previous month. Sales values for solar power plants are usually higher than for wind power plants. Reason for this is that PV feeds in at times of high electricity demand (by day); in contrast wind generation often takes place at times with low electricity demand.
Development of vRES generation in 2017
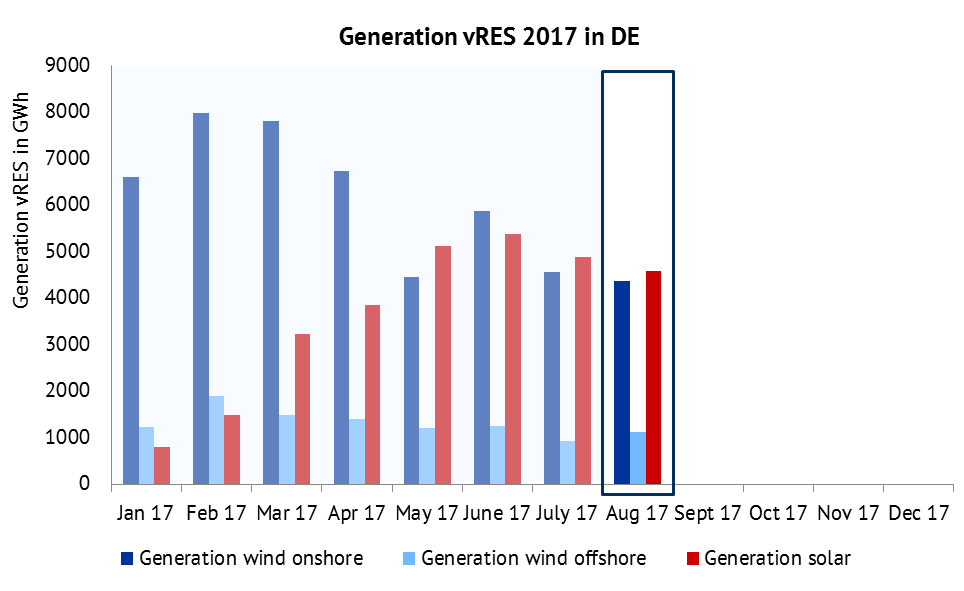
Figure 2: Electricity generation of wind onshore, wind offshore, PV in GWh. Source: Energy Brainpool, ENTSO-E Transparency
The downward trend in generation volumes for onshore and solar power plants continued in August 2017 (minus four per cent onshore and minus six per cent solar versus July 2017). Only offshore wind turbines posted an upwards trend of 20 per cent over the previous month. In August 2017, about three per cent of the total generation volumes (solar, wind-onshore and wind-offshore) were sold at negative prices.
Development of sales revenues in 2017
The sales revenues describe the technology-specific revenues of all onshore-wind, offshore-wind and solar plants in Germany at the spot market. The index is calculated from the product of the sales values and the generation at positive prices (sales volumes). The lower generation volumes and sales values in August versus July led to a sharp decline in revenues. Overall, the sales revenues of solar and onshore plants fell by around 14 per cent compared to the previous month. Only offshore plants were able to achieve an increase of seven per cent as a result of an increase in generation volumes.
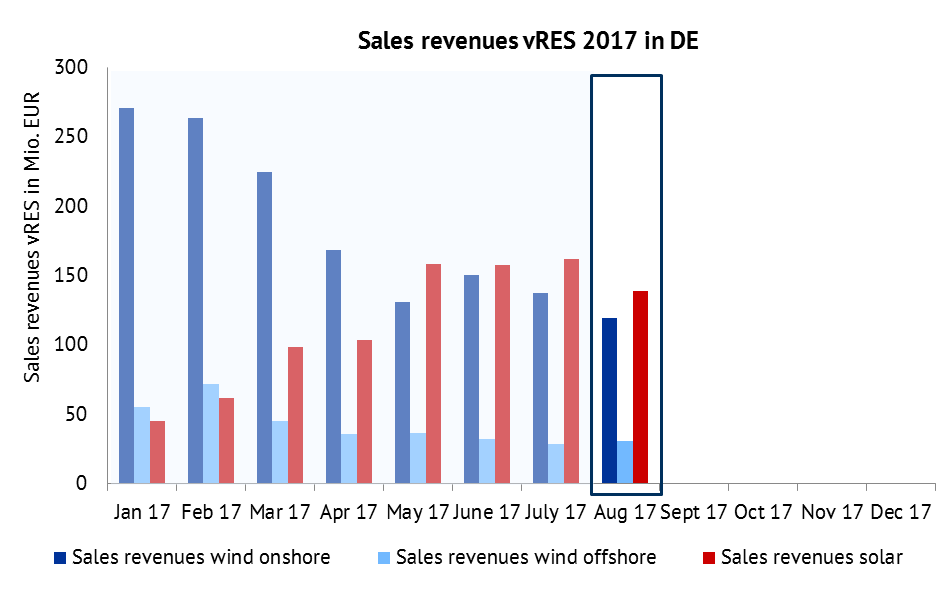
Figure 3: Development of sales revenues of vRES in mln. EUR in 2017. Source: Energy Brainpool, ENTSO-E Transparency, EPEX Spot
Development of baseload prices in 2017
Despite a low feed-in of vRES, baseload prices fell by around seven per cent compared to the previous month. The reason for this is due in particular to the low electricity demand caused by the summer break in August. Historically, August is the month with the lowest electricity demand in Germany. If production from vRES did not decrease in August as well, the decline in baseload prices would have been even more severe.
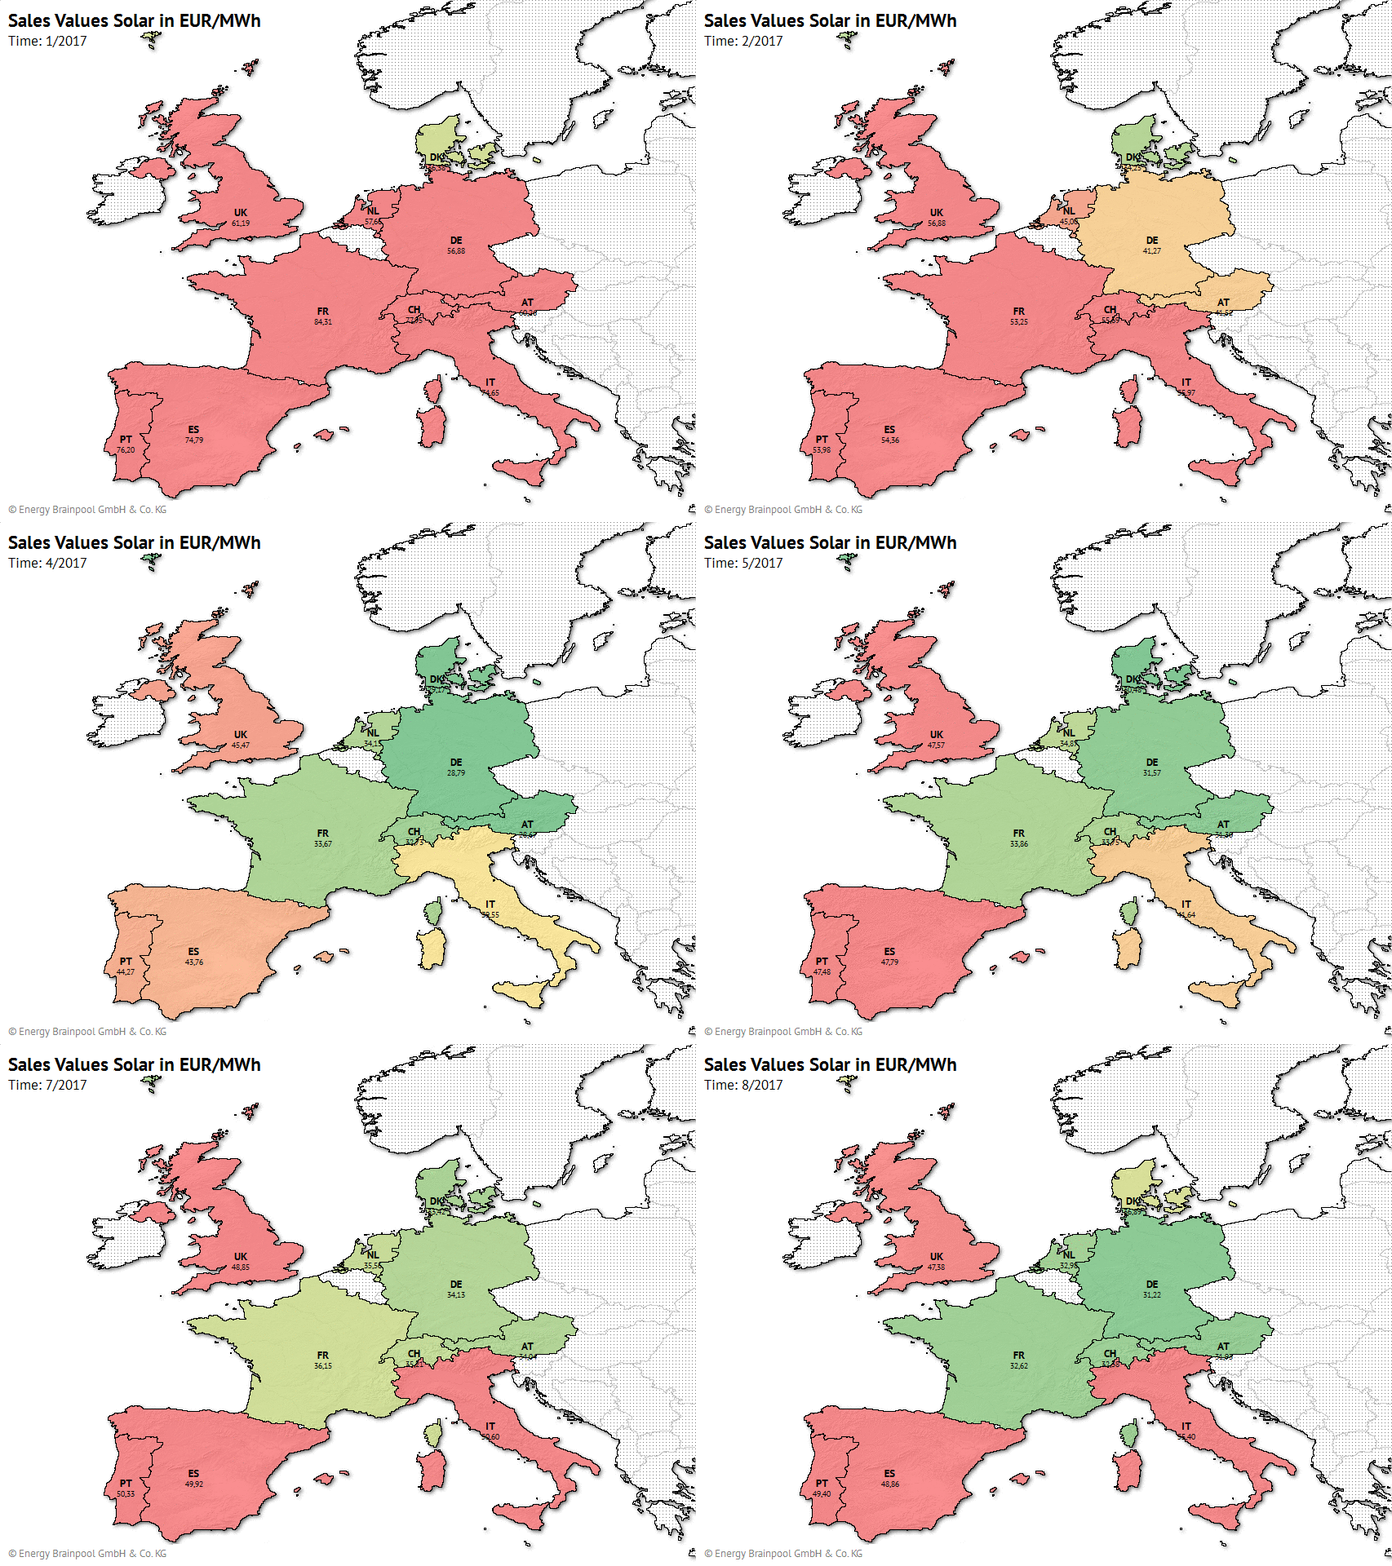
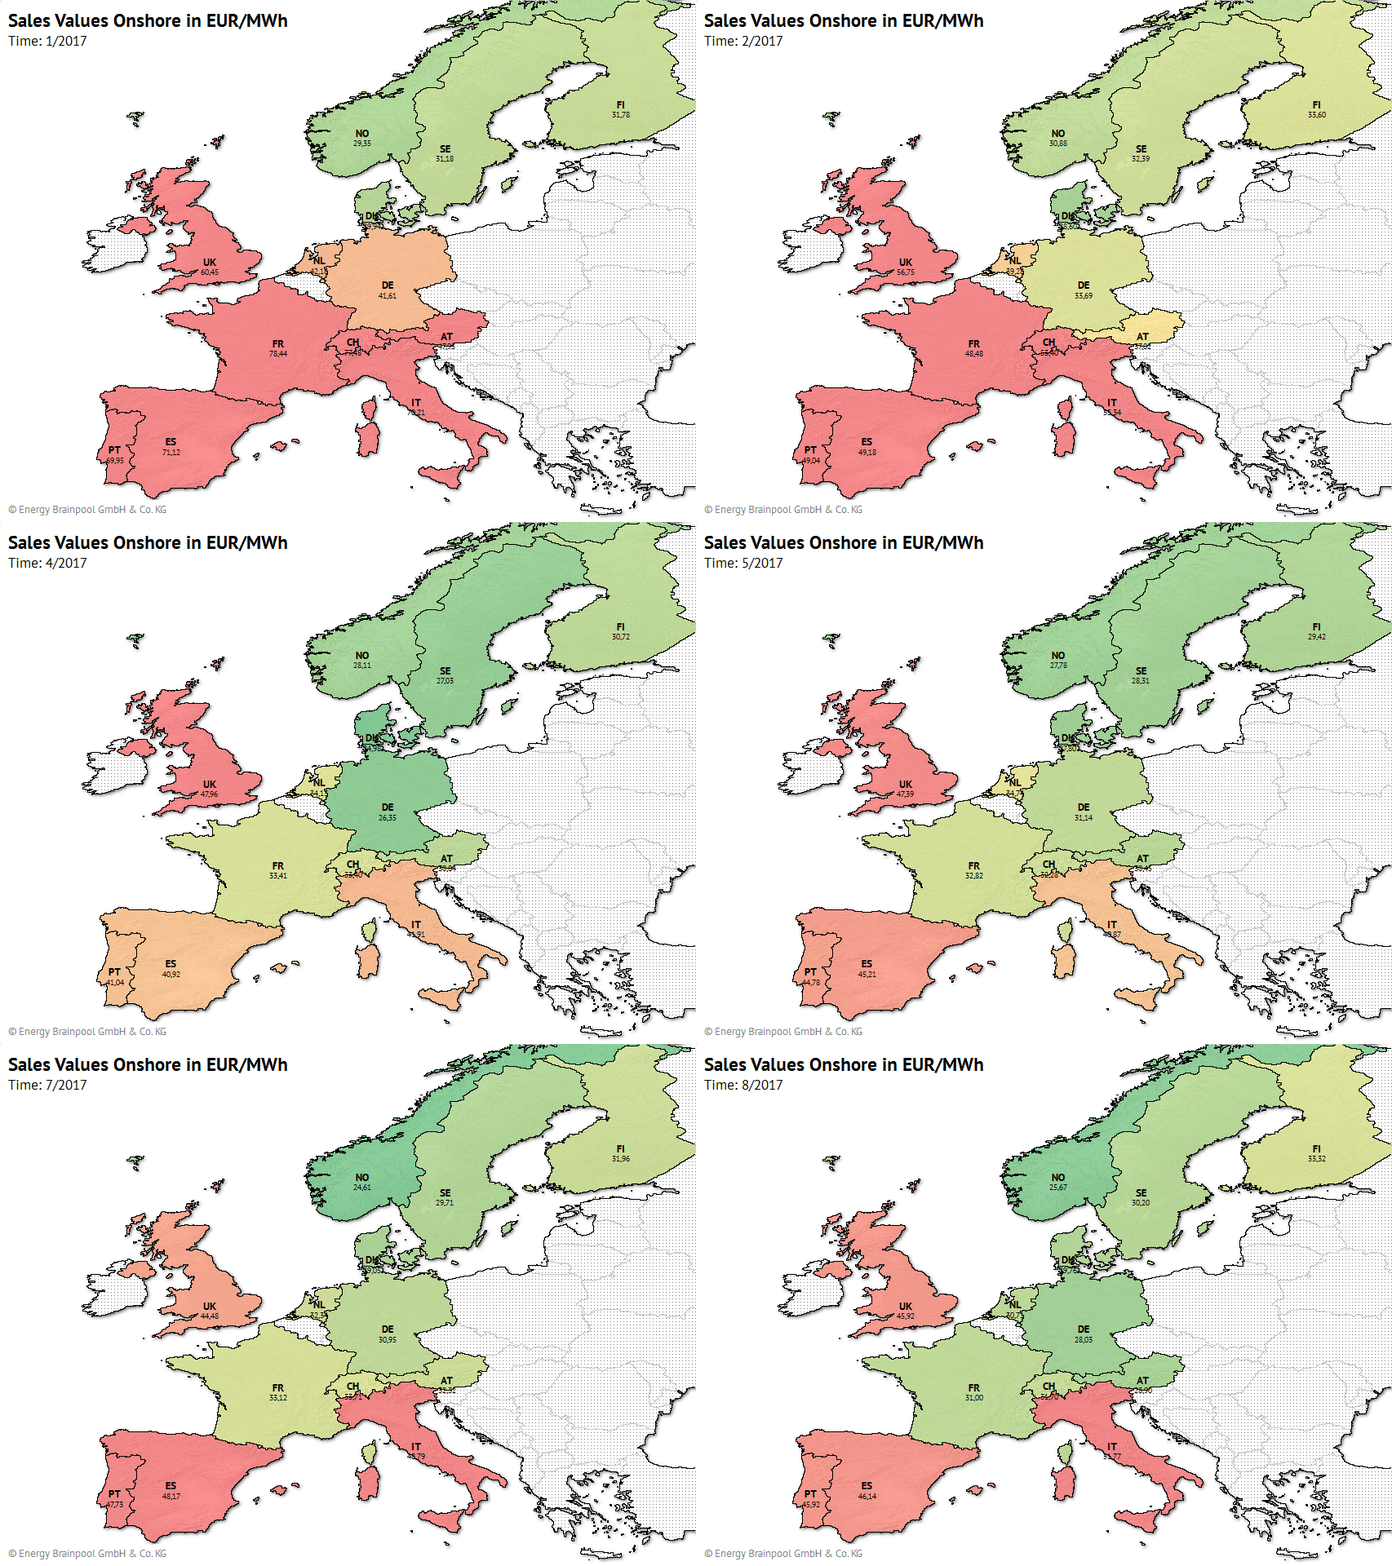
Development of vRES sales values in DE, DK, FI, FR, IT, NO, SE and UK
Other European countries followed a similar path of development with regard to sales values of solar and wind onshore in Germany, although at varying levels. The main reason for these differences is the generally varied price level due to differing demand patterns, generation structures and fossil fuel prices. Italy, Spain and the UK have the highest sales values amongst the listed countries. This is due to the strong dependence of electricity generation on gas-fired power stations, which are among the more cost-intensive power stations. In Scandinavia, however, inexpensive hydro power and nuclear power plants in particular determine electricity prices which lead to significantly lower sales values.



What do you say on this subject? Discuss with us!