With this article we continue the series of analysis on sales revenues of wind and PV power generation. On a quarterly basis, we take a look at the theoretically achievable sales revenues of onshore and offshore wind turbines as well as photovoltaic systems and analyse the background. This time, we look at quarter 3.

How are sales values and sales revenues for wind and PV determined? It is very important to understand this considering the expansion of variable renewable energy (vRE) systems without support from fixed feed-in tariffs. Whoever wants to sell electricity from vRE plants freely on the market must know the expected market prices. Moreover, the revenue potential of the respective plant portfolio depends on a combination of market prices and the time series of power generation.
The White Paper “Valuation of revenues from fluctuating generation” defines the parameters used here in this article (sales value, sales volumes, sales revenue) in more detail.
Development of the sales values in Q3 2019
The sales value indicates the volume-weighted, average electricity price of a vRE technology, taking into account only periods in which the electricity price at the power exchange is greater than or equal to zero.

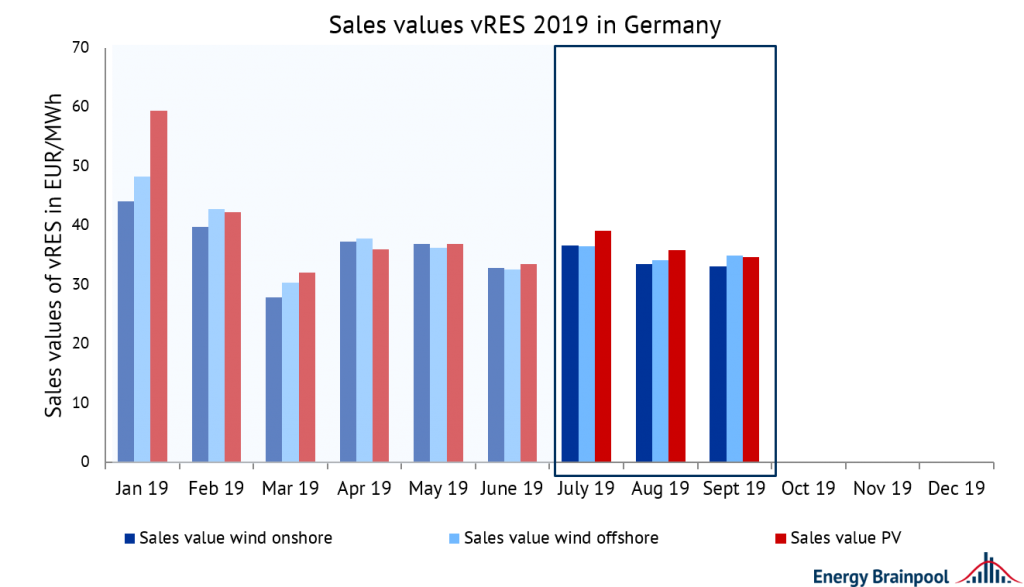
Figure 1: sales value of wind onshore, wind offshore and PV in 2019 in EUR/MWh. (Sources: Energy Brainpool, EPEX SPOT, ENTSO-E Transparency)
From July to September 2019 the sales values of wind were not very different from those of PV. In January 2019, however, the sales value of PV was around 14 EUR/MWh higher than that of wind onshore. In a quarterly comparison between Q2 and Q3, there was no change for the quarterly average of all three vRE types together.
If the technologies are considered individually, the sales value of wind has slightly deteriorated (-3.5 percent onshore, -1.1 percent offshore of Q3 compared to Q2), while the sales value of PV has slightly improved (+3.2 percent of Q3 compared to Q2).
Compared to the same period of the previous year (Q3-2018), however, there was a significant decline in the sales value of approx. 30 percent for all vRE technologies. This was due in particular to the fact that the average base price for the quarter was around 30 percent lower than in the quarter of the previous year. (see below for more details)
In September 2019, the sales value of PV was even slightly below that of wind offshore. This was due to relatively sunny September, which depressed electricity prices at midday. Meanwhile, offshore wind farms also produced electricity at off-peak times (morning, evening) when electricity prices were higher.
Development of generation and sales volumes in Q3 2019
The generation volume is the sum of all units of electricity produced in GWh over the period under consideration. However, the sales volumes only take into account those quantities of electricity generated that could be sold at electricity prices greater than or equal to zero. The sales volumes shall be expressed as a percentage of the generation volume.

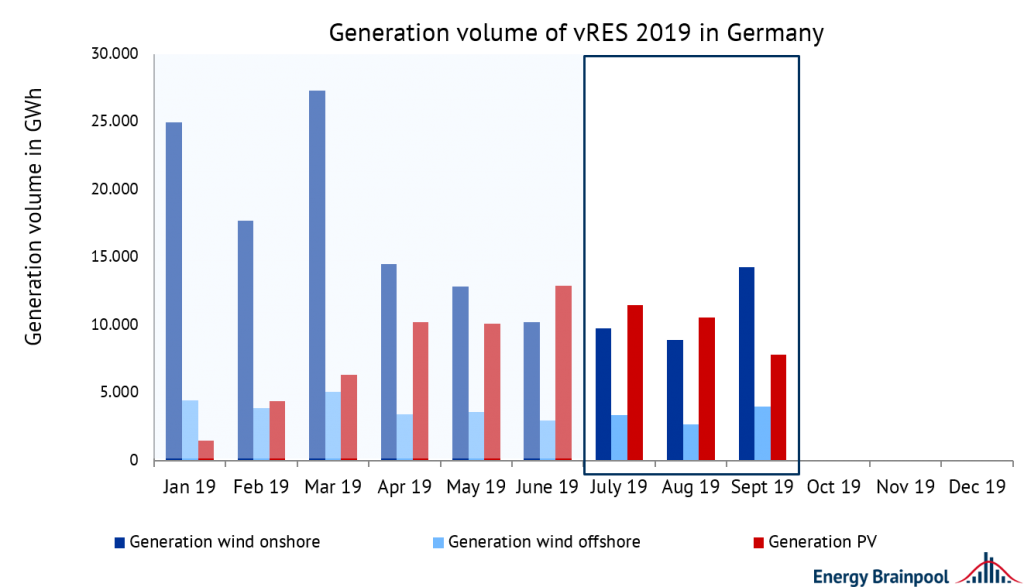
Figure 2: generation volume of wind onshore, wind offshore and PV in 2019 in GWh. (Sources: Energy Brainpool, ENTSO-E Transparency)
Relatively high PV generation volumes and low wind generation volumes characterize the third quarter of the year. These two opposing trends are a result of seasonality and can be clearly seen in Figure 2. Compared to the previous quarter, in Q3-2019 the generation volumes of wind onshore fell by around 12 percent and of PV by around 10 percent. Meanwhile, wind offshore generation remained almost constant.
Compared to the same quarter last year, total vRE generation more than doubled. This is remarkable, as you might recall the summer of 2018 with high irradiation in Germany. In fact, in Q3-2018, PV generation volumes were only half as high as in the same quarter a year later. One of the reasons for this is the increase in capacity, which amounted to around 1.6 GW in the first four months of 2019 alone. [1]
In the case of offshore wind power, the generation volume has even tripled, in particular due to newly connected offshore wind turbines.
Sales volumes in July 2019 were 100 percent, as there were no negative electricity prices. The sales volume for August and September 2019 was around 96 percent. The average value for Q3-2019 across all vREs was 97.6 percent. Compared to the previous quarter, sales volumes increased slightly (wind onshore +2.8 percent, wind offshore +1.9 percent, PV +2.9 percent), but fell by approx. 1.8-2.5 percent year-on-year.
This indicates an increasing number of hours with negative prices compared to last year. Looking back to the summer of 2018, it is also interesting to note that the sales volumes stood at 100 percent for three consecutive months (June to August 2018). In fact, negative electricity prices have been very rare in the past ten years from June to September (less than 35 hours per month).
Baseload prices and sales revenues of PV and wind in Q3 2019
The sales revenues describe the technology-specific average revenues of the vRE plants in Germany. They are calculated as the product of the sales value and the sales volume. The baseload price is the average price (non-weighted) of the day-ahead auctions at EPEX Spot power exchange.

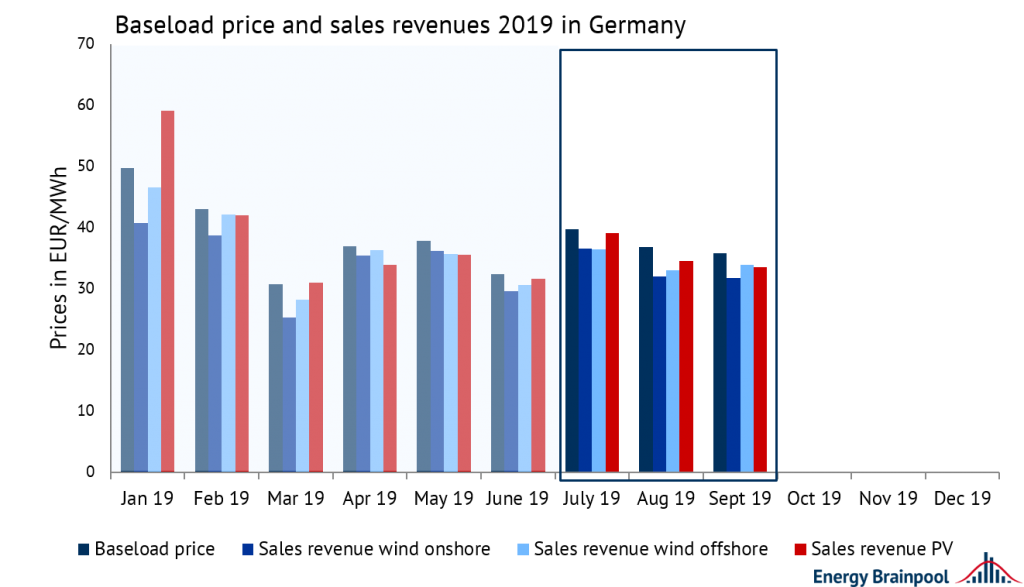
Figure 3: development of baseload prices and sales revenues of wind onshore, wind offshore and PV in 2019 in EUR/MWh. (Quelle: Energy Brainpool, ENTSO-E-Transparency, EPEX SPOT)
Figure 3 shows a comparison of monthly sales revenues and baseload prices. Historically, the baseload price in Germany has always been lower in summer than in winter, as demand is higher during winter. However, this pattern has been broken up more and more by the vRE plants over the last years. For example, we see a low baseload price for March 2019, while it was relatively high in July.
As can be seen in Figure 2, production volumes for wind onshore were extremely high in March 2019, depressing the price. The high prices in July were partly the result of expensive CO2 certificates and the fuel switch in the merit order between gas and coal-fired power plants.
On a quarterly average, baseload prices in Q3-2019 were approximately 5 percent higher than in Q2. However, they were 30 percent lower than in the same quarter a year ago. In 2018, many conventional power plants were unable to offer their full generation capacity to the market due to the ongoing heat wave. This has led to a shortage of supply, resulting in higher prices.
Monthly sales revenues in 2019 were almost always below the baseload price, except for PV in January. Since the cannibalisation of PV systems by weak solar radiation in winter is not significant, PV systems can benefit from higher electricity prices during the day. In most cases, PV’s sales revenue was higher than wind’s, with exceptions in April and May. This was influenced by the particularly sunny holidays in those months, which led to very negative prices at Easter, for example.
For wind onshore, it can be observed that its sales revenue is usually the lowest compared to other technologies. The reason for this is the relatively strong cannibalization effect. This means that with large wind fronts, the price on the electricity exchange is massively depressed and the kilowatt hours fed in from the wind turbines are of low value. Since offshore wind turbines have less generation capacity and a more constant feed-in profile, cannibalisation is not (yet) having such a strong effect here.
External sources:
[1]: https://www.pv-magazine.de/2019/05/31/photovoltaik-zubau-im-april-bei-gut-300-megawatt/


What do you say on this subject? Discuss with us!