The decisive topic for the energy industry in August 2018 was the record temperatures, which together with new record high prices for CO2-certificates of over 20 EUR/ton boosted electricity prices. It seems that higher prices for commodities and electricity will become the new “normal”.
Tenders for renewable energies
There is still no clarity on the special tenders for PV and wind onshore in 2019 and 2020. Thomas Bareiß, Parliamentary State Secretary in the Federal Ministry of Economic Affairs and Energy, at least announced that there will be clear details in a draft law by the end of 2018 (source: PV Magazine). Bareiß did not give any information about the amount, however. He said: “We have to consider exactly how much we are putting into the market now and in what time frame we are doing this”.
Weak competition and fear of rising subsidy costs
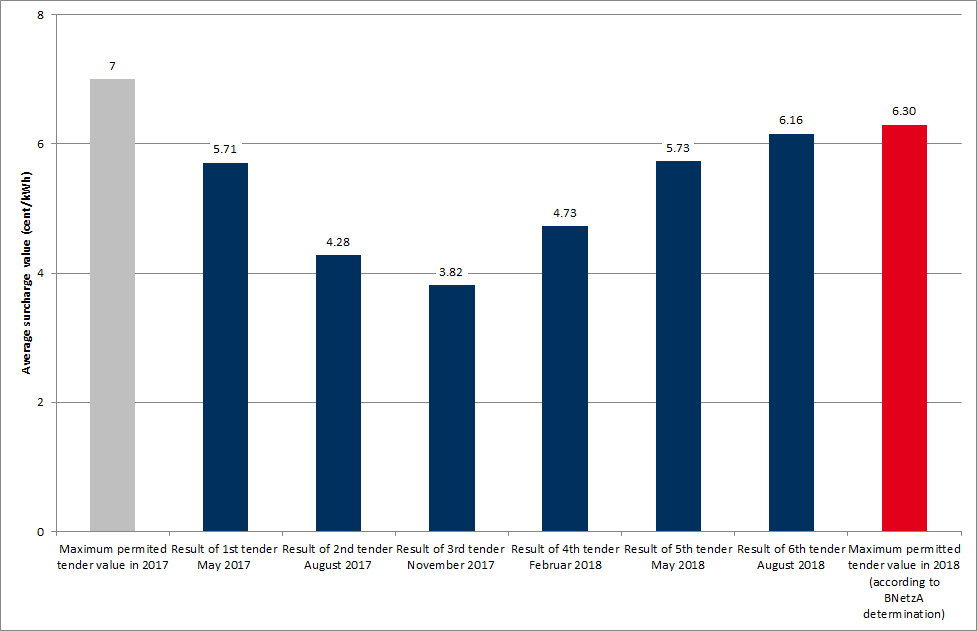
Politicians seem to be afraid of rising subsidy costs against the background of the third tender round for wind onshore. A rather weak competitive pressure ensured that all bids were successful (source: Federal Network Agency). The average award value increased compared to the second tender of May 2018 and amounted to 6.16 ct/kWh. This represents an increase of eight percent, and thus the highest award values since the introduction of renewable tenders in Germany. A project with a maximum bid of 6.3 ct/kWh was also awarded. However, the range of surcharge values in the tender of August was a remarkable 2.3 ct/kWh. This shows the great variability of wind projects, and to some extent also the changing bidder behavior. Figure 1 shows the average award values for wind onshore tenders in Germany.
However, in order to achieve the targets in the coalition agreement (65 per cent renewable energies in gross electricity consumption), special annual tenders in the amount of about 1.5 GW would have to be issued for wind onshore alone from now until 2030. In particular, the expected dismantling of old plants in the next decade must be taken into account.
More heat pumps, electric cars and home storage
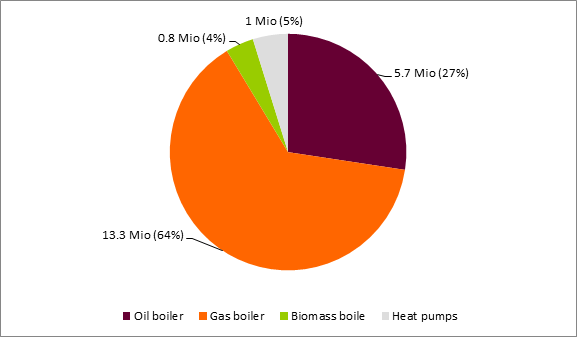
The growth of sector coupling technologies is picking up speed. The number of heat pumps rose to over one million by the end of 2017. However, heat pumps only account for five percent of all 21 million heating appliances in stock, as the Federal Association of the German Heating Industry (BDH) and the Federal Association of Chimney Cleaners (ZIV) jointly reported (source: BDH and ZIV). Figure 2 shows the number of different heat generators installed in Germany. The majority still uses gas or oil as fuel.

Figure 2: Number (in millions) and share (in %) of different technologies in the heat generation sector
The number of fully electric cars has also increased. At the beginning of August 2018, more than 73,600 battery-powered cars were driving on German roads (source: KBA). In addition, the 100,000th battery home storage facility was commissioned at the end of August 2018 (source: PV Magazine).
Gas market and LNG
The merger of the market areas Netconnect Germany and Gaspool by 1st of October 2021 stimulates discussions about an even more extensive integration. For example, the Dutch Gasunie Transport Service has submitted a basic concept for a project to the German transmission system operator. In this project, the Dutch virtual trading point TTF is also to be integrated into the newly emerging German market area. TTF is the most liquid market area in Europe and the combination with the overall German market would represent a very attractive trading market for gas producers and consumers (source: Energate).
EU supports LNG
Increased demand for gas is also pushing imports of LNG (liqufied natural gas). Since April 2016, 2.8 billion cubic meters of LNG have been delivered in 40 tanker from the USA to Europe. The LNG infrastructure in Europe is to be further expanded, with the EU co-funding. Brussels is supporting 14 LNG projects which are to increase Europe’s import capacity by a further 15 billion cubic metres by 2021. In the US, liquefaction capacities of 28 billion cubic meters currently exist, which will increase to over 100 billion cubic meters by 2023 (source: Energate). Germany does not possess an LNG terminal, but there are currently three locations in Germany where the construction of regasification plants are considered. The possible locations are Brunsbüttel, Wilhelmshaven and Stade. However, there is still no final decision by the various consortia as to whether one of the three sites will actually be developed (source: Energate).
Heat wave and CO2 are driving the markets
The high temperatures at the beginning of August 2018 have led to cooling water problems in several German and French power plants (source: Montel). The release of cooling water into the respective rivers is only permitted if rivers do not heat up above 28 degrees Celsius. As a result, power plant operators in Germany had to apply for special permits for the discharge or partially reduce the output of their power plants. The power stations on the Rhine were particularly affected. The possibility of supplying coal to power plants was also affected by low water levels (source: Montel).
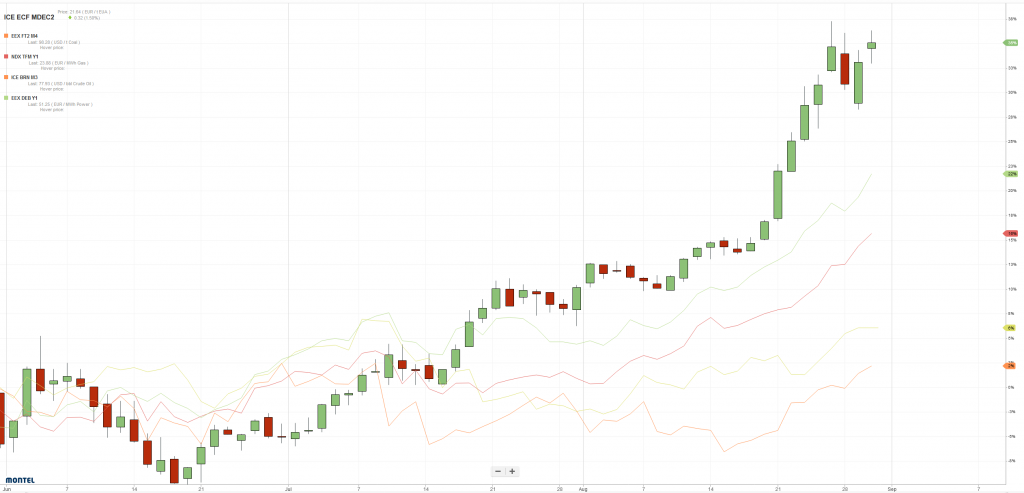
However, the cooling water and transport problems were not the only reasons for very high electricity prices on the markets. Commodity prices rose sharply during August 2018. For example, the prices for CO2 certificates for delivery in December 2018 climbed to 10-year highs, rising from EUR 17 per ton to just under EUR 22 per ton during August 2018. At the same time, oil prices and, as a result, gas prices rose. Coal prices were also pressured up to a 6-year high, in particular due to high demand from Asia. All these factors led to long-term electricity prices for the front year rising to their highest level since August 2012. The base load delivery for 2019, for example, exceeded 51 EUR/MWh on 30th of August 2018. This corresponded to a 17 percent increase from less than 45 EUR/MWh during this month. Figure 3 shows the relative price development of various commodities over the last three months (source: Montel).

Figure 3: Relative price development of CO2-certificates (candle sticks), base load electricity 2019 (green), base load gas 2019 (red), coal (yellow) and oil (orange) from June 2018 to August 2018 (source: Montel)
The increase can be seen through the bank and picked up speed especially in August.
What happens on the short-term side?
Higher commodity prices, the heat wave and low wind availability also had an impact on the short-term side. Hourly prices above 70 EUR/MWh were not uncommon despite high solar feed-in. With higher wind input, prices fell below 30 EUR/MWh from 9th to 10th of August or in the night of the 27th of August 2016. All in all, however, spot market prices were very stable and averaged just under 60 EUR/MWh. Figure 4 shows the hourly day-ahead prices and the respective generation technologies.


