In July 2017, the production of variable renewable energy sources (vRES) fell by approx. 17 per cent compared to the previous month. With a drop of around 23 per cent onshore and offshore technologies, were particularly affected. In contrast, the sales values for wind-onshore and wind-offshore increased by around 20 percent and 16 per cent for solar power plants compared to June 2017. Hence, the sales revenues remain at a constant level.
Development of sales values and generation of vRES in the year 2017
The sales values represent the weighted average vRES market revenue. The key performance indicator of the sales revenue is explicitly defined in the white paper “Valuation of revenues of fluctuating renewable energy sources”.
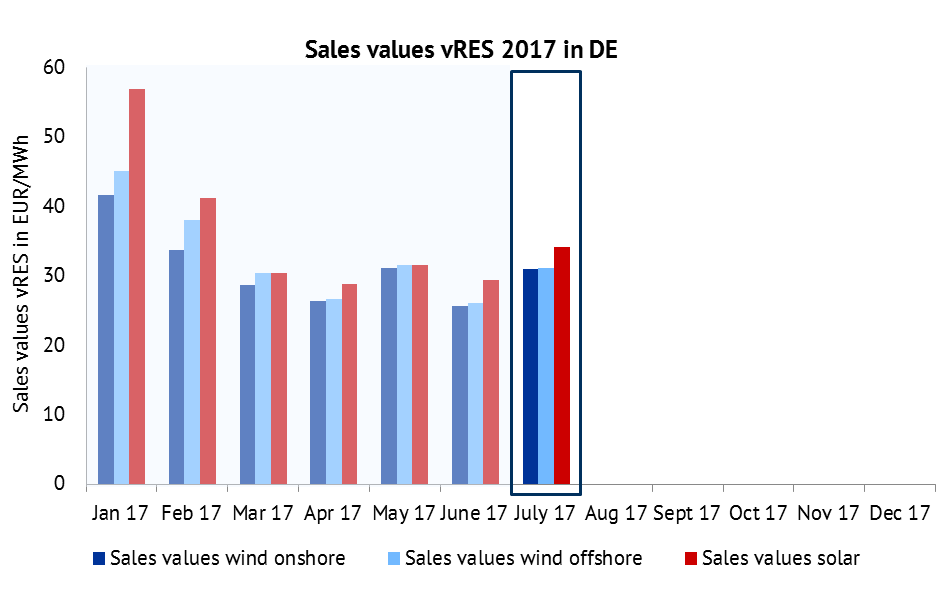
Figure 1: Sales values for wind onshore, wind offshore, PV in EUR/MWh. Source: Energy Brainpool, EPEX Spot, ENTSO-E Transparency
In July the sales values of all vRES technologies rose compared to June. Onshore and offshore wind turbines generated around 20 per cent higher revenues per megawatt hour, while solar plants were able to record 16 per cent higher revenues per megawatt hour.
Reason for these significantly higher sales values for solar power plants compared to wind is that PV feeds in at times of high electricity demand (by day); in contrast wind generation often takes place at times with low electricity demand.
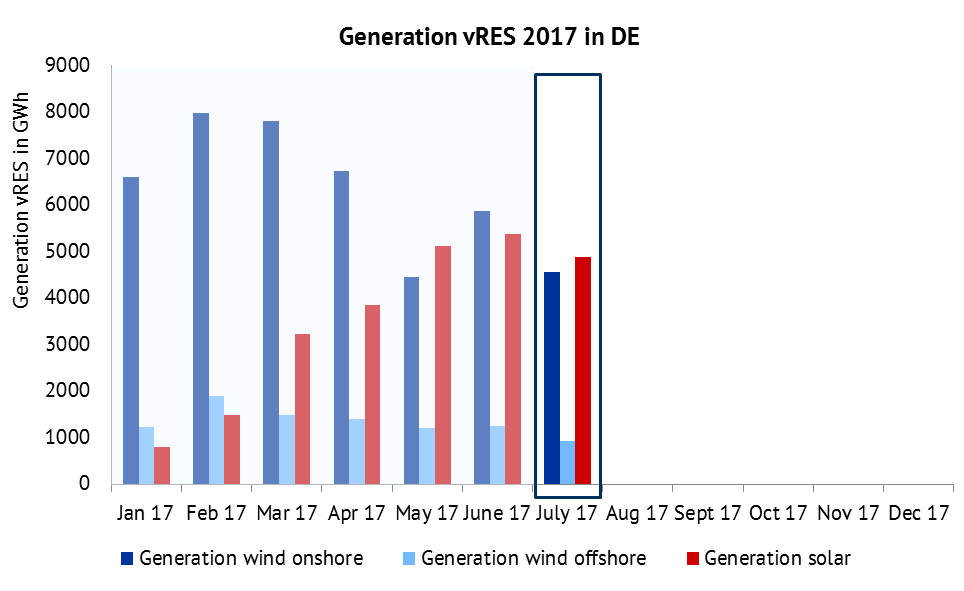
Figure 2: Electricity generation of wind onshore, wind offshore, PV in GWh. Source: Energy Brainpool, ENTSO-E Transparency
The upward trend of electricity generation from onshore wind turbines in June broke off in July – the volumes fell by about 23 per cent compared to June. Offshore wind turbines and solar plants also recorded a lower sales volume (minus 25 per cent for offshore, minus 9 per cent for solar). In July 2017, about 2 percent of the overall production volumes (solar, wind-onshore and wind-offshore) were marketed at negative prices.
Development of sales revenues vRES in 2017
The sales revenues describe the technology-specific revenues of all onshore, offshore and solar plants in Germany. The index is calculated from the product of the sales values and the production quantities at positive prices (sales volumes). The lower sales volumes in July were nearly balanced out by the plus in the sales values. Despite lower volumes, sales revenues for solar plants increased by approx. 3 per cent. On the other hand onshore wind turbines recorded a 12 per cent drop in sales revenues; offshore wind turbines approx. 9 per cent compared to the previous month.
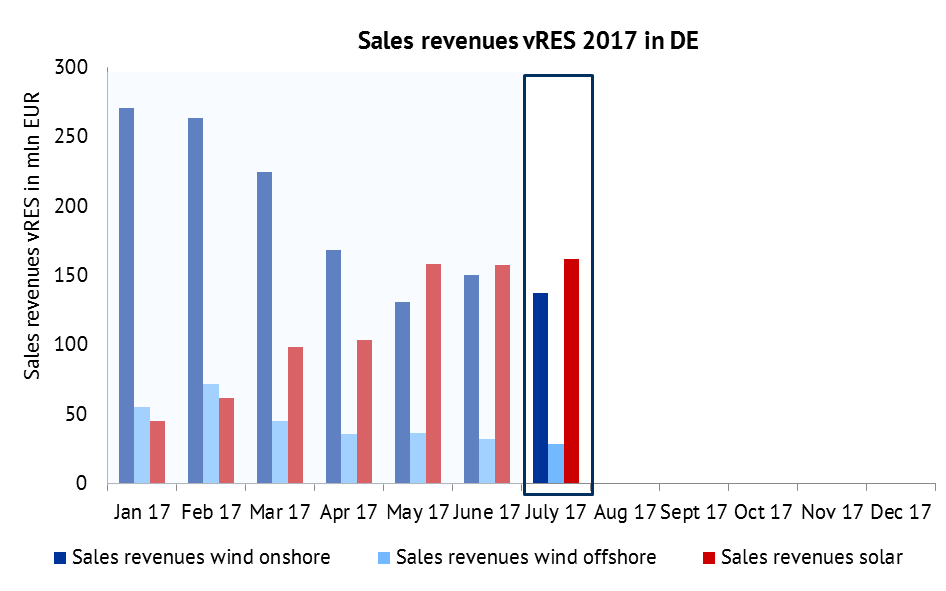
Figure 3: Development of sales revenues of vRES in mln EUR in 2017. Source: Energy Brainpool, ENTSO-E Transparency, EPEX Spot
Development of baseload prices in 2017
The lower feed-in of vRES in July 2017 is also reflected in the baseload prices, which rose by around 10 per cent compared to the previous month. Due to the lower feed-in of vRES, more expensive generation technologies had to be employed, which led to higher electricity prices.
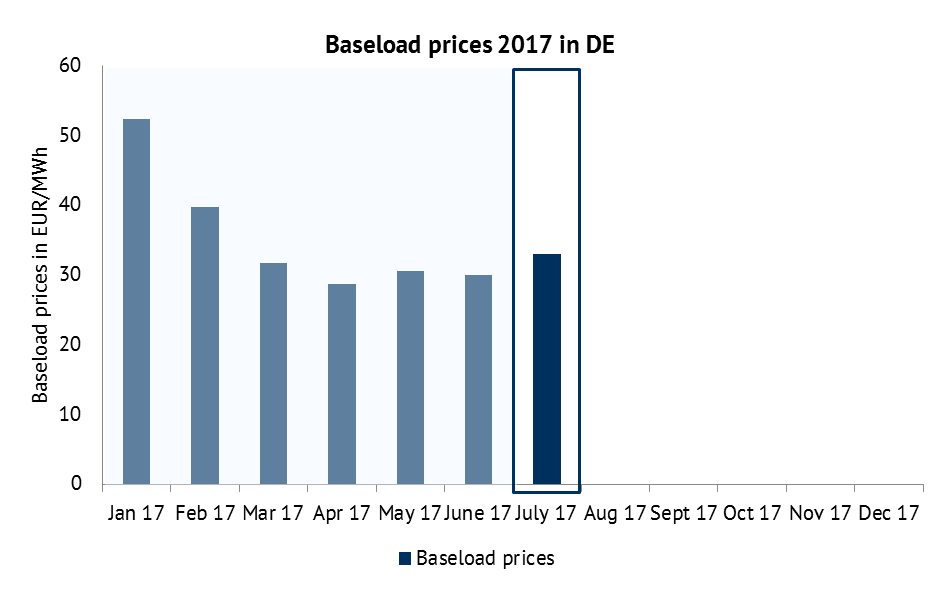
Figure 4: Development of baseload price in 2017 in EUR/MWh. Source: Energy Brainpool, EPEX Spot
Development of vRES sales values in DE, DK, FR, IT, NO, SE and UK in 2017
Other European countries followed a similar path of development with regard to sales values of solar and wind onshore in Germany, although at varying levels. The main reason for these differences is the generally varied price level due to differing demand patterns, generation structures and fossil fuel prices.
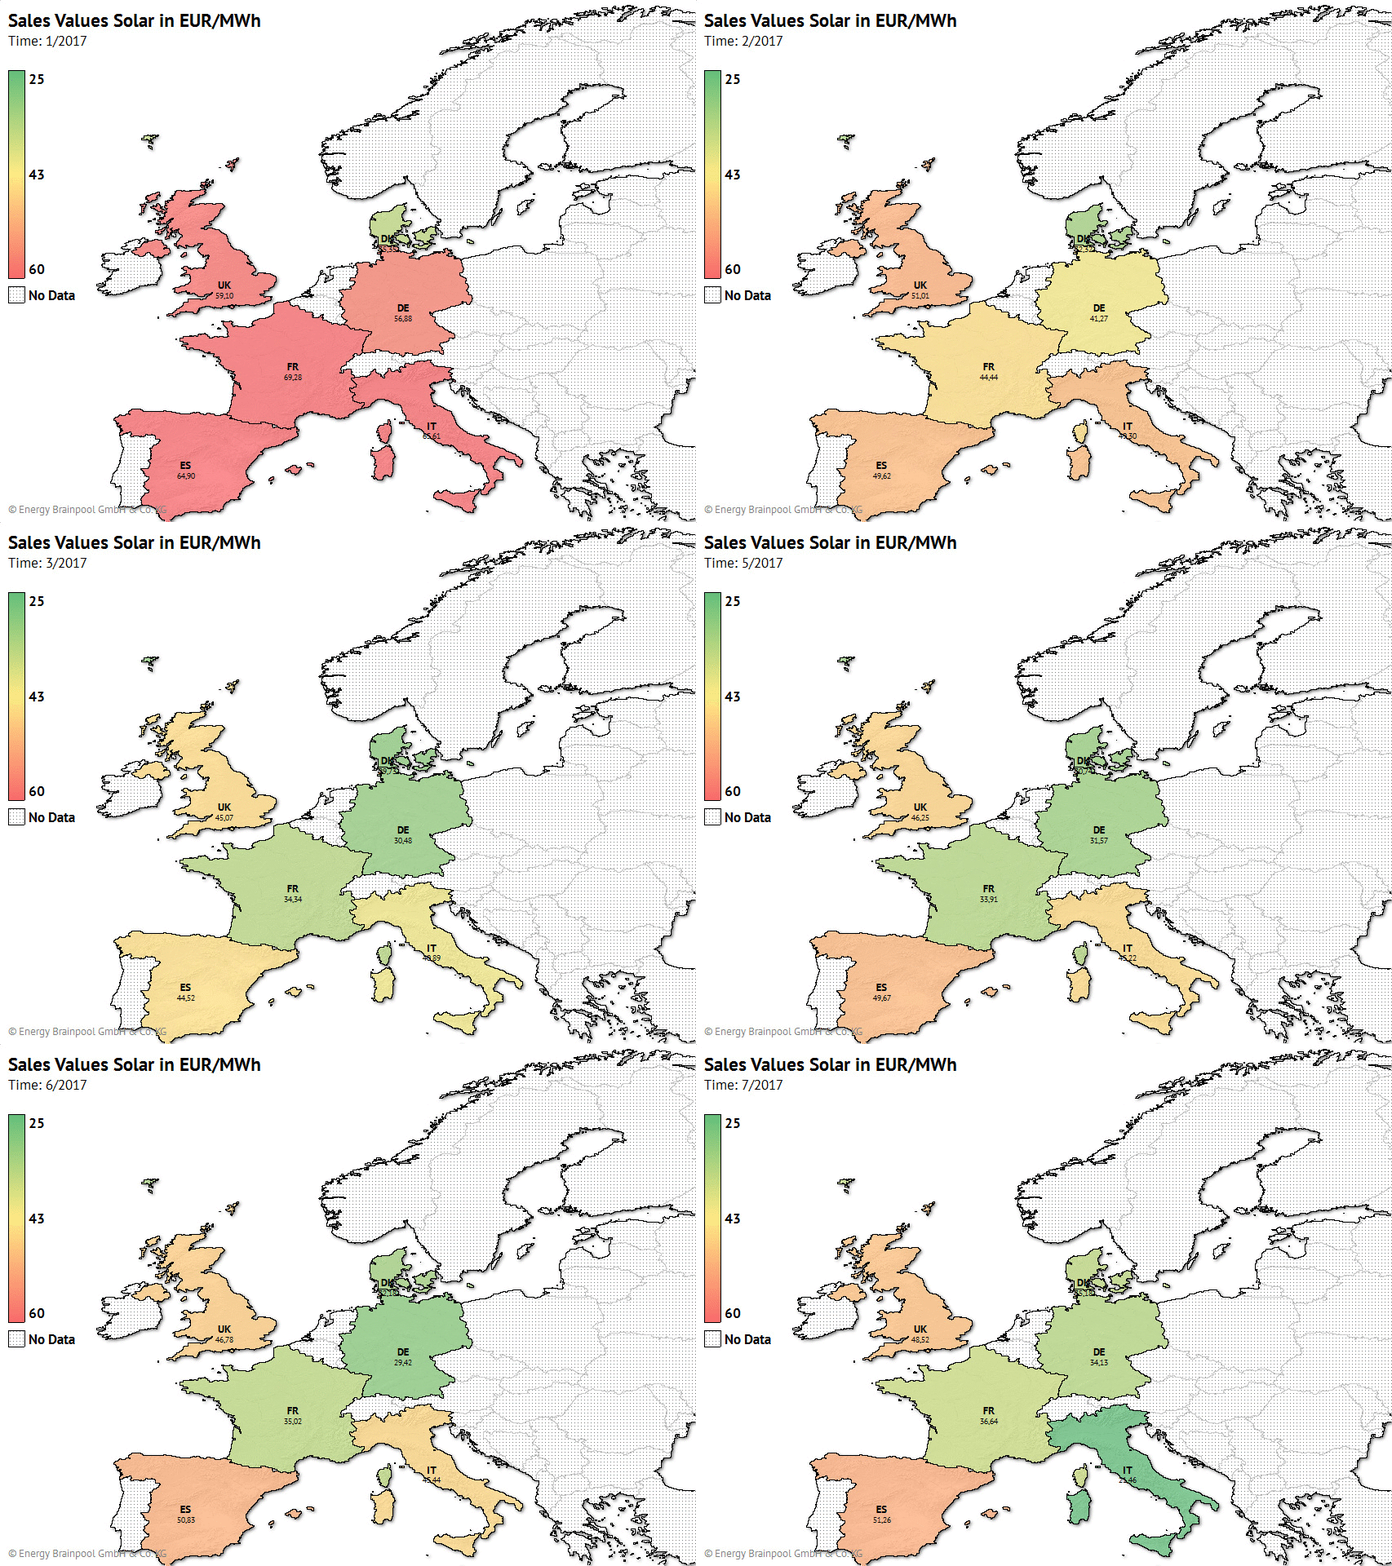
Figure 5: Development of solar sales values in EUR/MWh in GER, FR, ES, IT and UK. Source: EPEX Spot, N2EX (Nordpool), GME, Omie, Nordpool, ENTSO-E Transparency, Calculation and presentation: Energy Brainpool
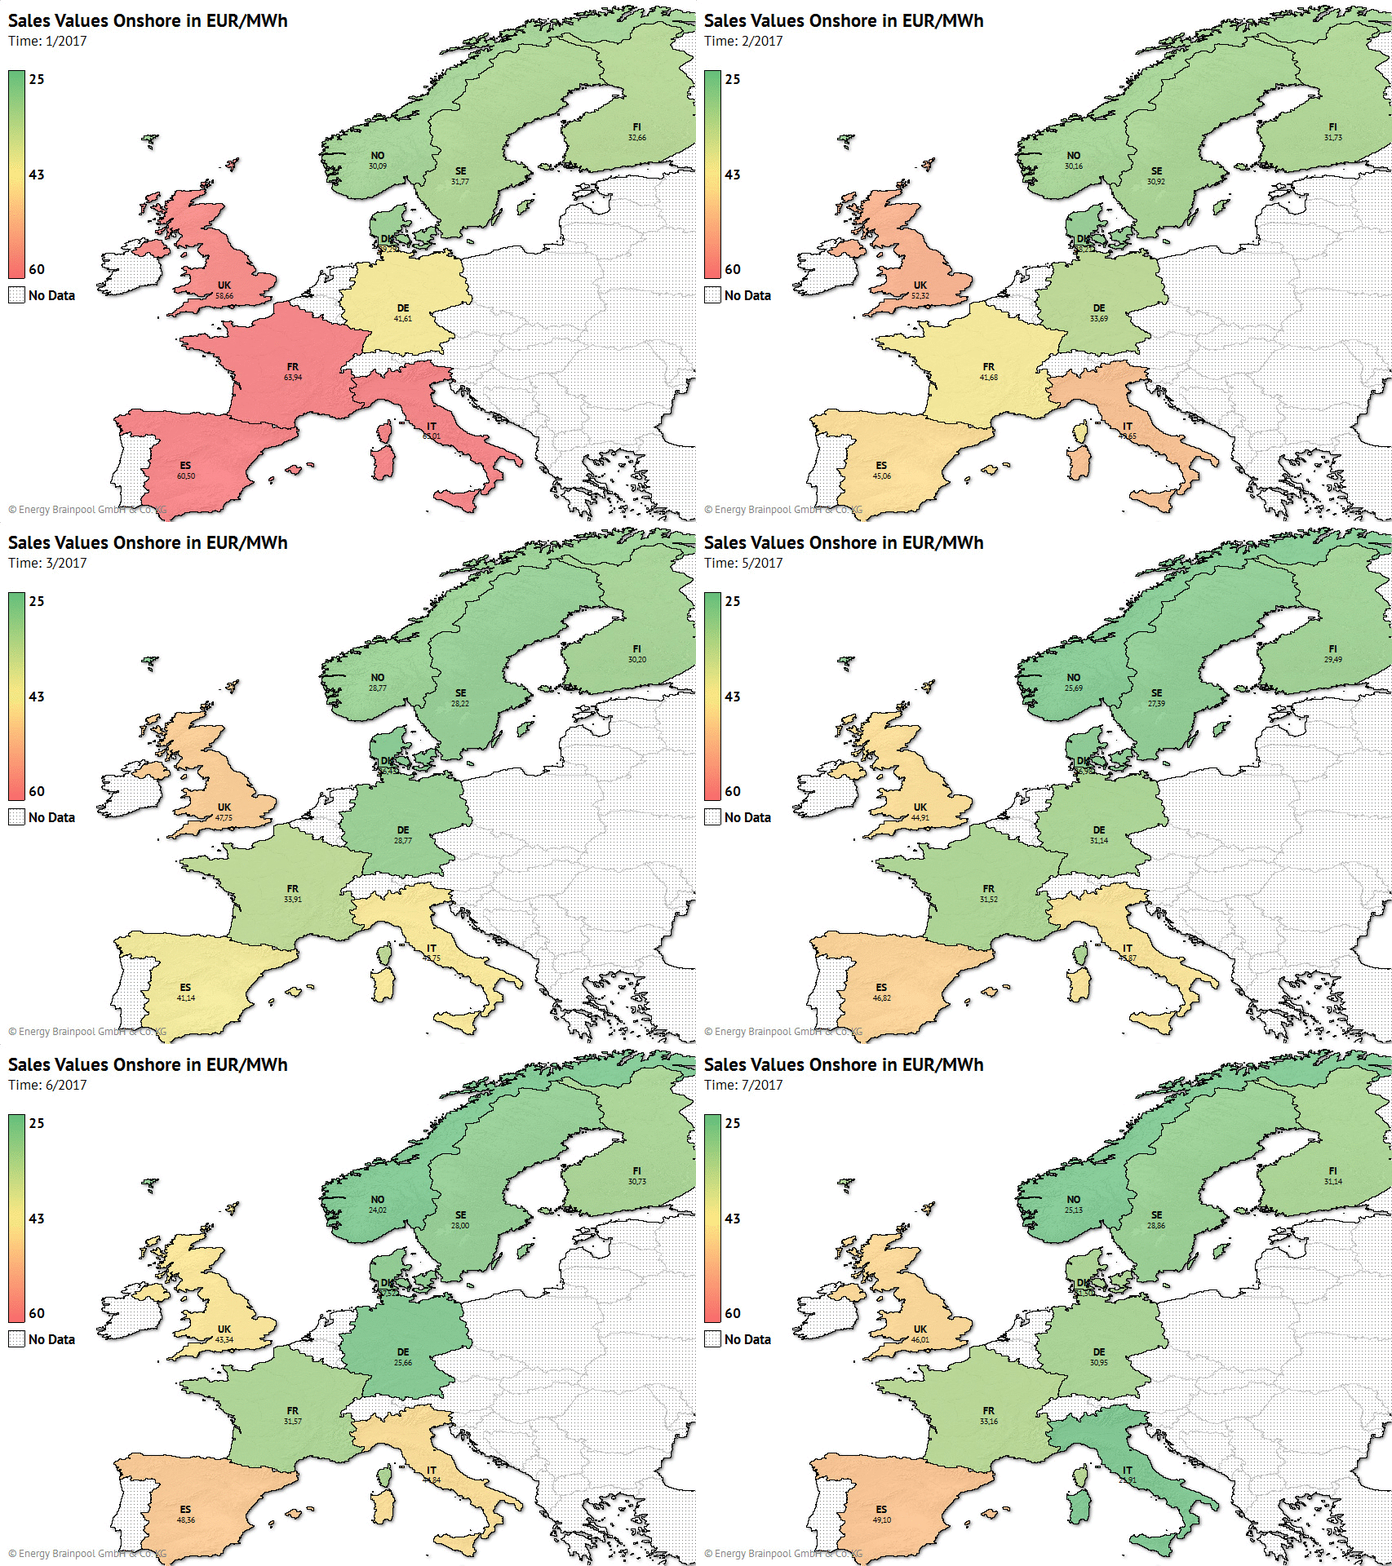
Figure 6: Development of wind onshore sales values in EUR/MWh in GER, FR, ES, IT and UK. Source: EPEX Spot, N2EX (Nordpool), GME, Omie, Nordpool, ENTSO-E Transparency, Calculation and presentation: Energy Brainpool


