The influence of variable renewable energy sources (vRES) dominates the day-ahead market. The displacement of conventional power plants during high feed-in of vRES affects prices and generation volumes. For the Calendar Week 25 (19 – 25 June) it is analysed how conventional power plants need to adjust their scheduling because of the vRES feed-in.
Calendar week 25 (19 – 25 June) is taken into account for this specific evaluation. The beginning of that week was characterised by high PV feed-in and low wind power generation, which increased towards the end of the week (Figure 1). The maximum (combined) generation approx. reached 42 GW and the minimum was at around 1 GW.

Figure 1: Generation of wind and solar during calendar week 25 (source: https://www.energy-charts.de)
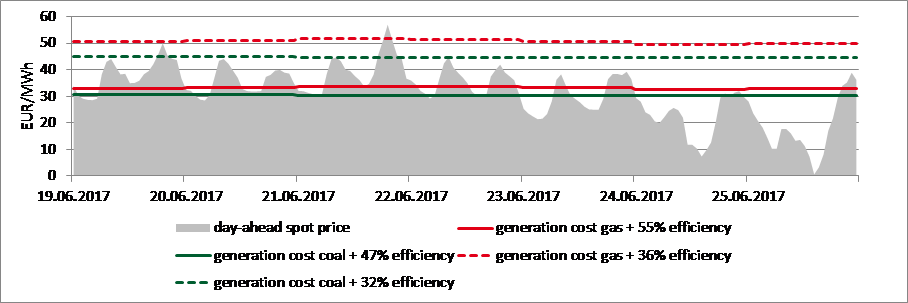
Because of the low price for natural gas and the comparatively high prices for hard coal, short-run marginal costs were closely linked (Figure 2). Therefore, electrical efficiency, technical flexibility as well as other restrictions or sources of revenue2 are determining for the resulting use of power plants.

Figure 2: Day-ahead prices and generation costs (3) of hard coal and natural gas during calendar week 25 (Source: EPEX, EEX, own calculation)
Mid-week the generation scheduling of hard coal power plants showed a generation up to 18 GW – roughly half of the installed hard coal capacities (Figure 3). The required flexibility was achieved by adjusting the power output – while some power plants generated at a constant level others reduced their output in accordance with the demand. Towards the end of the week generation of vRES significantly increased and the overall weekend demand declined, with the result that many hard-coal power plants were entirely shut off and the remaining power plants produced with reduced output.

Figure 3: Generation from hard coal power plants during calendar week 25 (Source: www.energy-charts.de)
Taking a first look at natural gas power plants (Figure 4) they initially revealed little flexibility. Up until the middle of the week gas fired power plants generated at a constant capacity level. Any flexibility was brought about by short-term on and off switching of single gas power plants. Interestingly, gas power plants reduced their power output one day later than the hard coal power plants; mainly through shutting down a large power plant. At first glance it seems as if gas power plants do not want to or cannot provide as much flexibility as hard coal power plants in this situation. In consideration of the performance measures, however, this hasty conclusion must be revised. This week a maximum of 6 GW (right below 20 %) from approx. 30 GW installed gas capacities was on the grid. At the end of the week it was only 1 GW, therefore below the 5 % mark. Of course this implies that all or most of the installed power plant capacities are taken into account by the data source.

Figure 4: Generation of gas fired power plants during calendar week 25 (Source: www.energy-charts.de)
The evaluation of this week in June clearly shows that the necessary flexibility from high vRES feed-in did not come from gas-fired power plants. However, hard coal power plants seemed to provide significantly more flexibility. The actual flexibility came from surrounding markets though (cf. Figure 5). The import/export balance varied between -1 and -12 GW (export). This allowed for stabilising the flexible power generation of the conventional power plants, which was actually required considering the domestic residual load4.
Figure 6 clearly shows that in case of a high PV feed-in roughly half of the hard coal and gas production was exported by the middle of the week and therefore, was actually not needed to cover the domestic demand. With increasing wind production and decreasing demand, hard coal and gas production was fully exported by the end of the week. This demonstrates that the domestic power plant fleet is subject to the repression and, therefore, the deterioration of prices by the vRES. However, the resulting flexibility is mainly absorbed by the existing coupling capacities and the surrounding markets such as France and the Netherlands. At least during the evaluated week hard coal power plants seemed to have reduced their output as required but the flexibility cannot be viewed in the same way for gas-fired power plants. However, the low gas power output of less than 6 GW suggests that other factors, such as avoided grid charges and heat generation, could have decisively influenced the way of dispatching.

Figure 6: Import/export balance, hard coal and gas power plants during calendar week 2 (Source: www.energy-charts.de)
1ascending, ordered curve of the power plant capacities considering the short-term generation costs (commodities, CO2, start-up costs, excl. fixed and financing costs)
2for example: avoided grid charges, heat generation, balancing energy allocation
3Spot prices for gas of the market area NCG, hard coal futures for June 2017, EUA spot prices
4domestic electricity demand minus feed-in of wind and solar


