CO2 emissions from the European Emissions Trading Scheme (ETS) increased in 2017. In Germany, on the other hand, they declined. With PPAs, companies are increasingly focusing on renewable energies, while China made almost half of all investments in wind and PV last year. German Minister Altmaier is striving for an urgent reform of the EEG and the KWKG. Power derivatives rise to 4.5-year highs with strong commodity support.
Mixed balance for CO2 emissions
The EU Commission’s assessment shows that CO2 emissions from the European emissions trading system increased for the first time in seven years in 2017. Emissions rose by an average of 0.3 percent over the past year to 1.75 billion metric tons of CO2, according to Sandbag, a UK-based climate protection organization, as a result of increased emissions from industry, particularly from larger steel production. Furthermore, emissions from the energy industry decreased by only 1 percent, as low generation from hydropower and nuclear power was offset by gas power plants (Source: Sandbag).
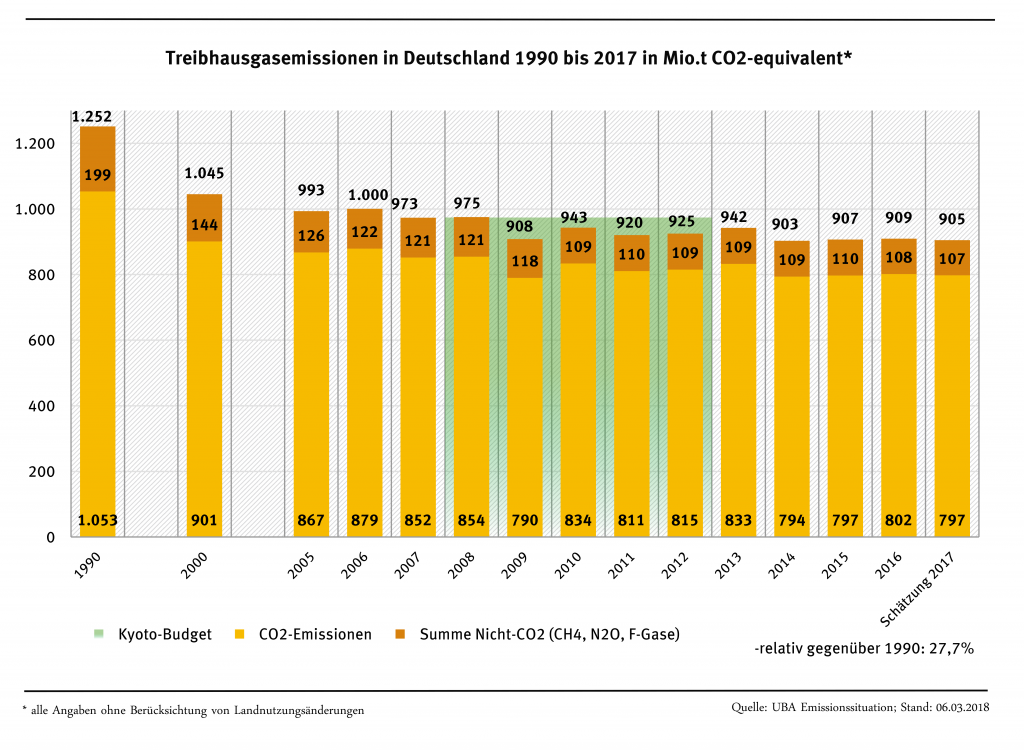
In Germany, on the other hand, the picture was more positive. In Germany, CO2 emissions from plants in the emissions trading fell slightly in 2017. According to the Federal Environmental Agency, this reduction was as high as 3.4 percent. The energy industry in particular contributed to a reduction in emissions by around 4.7 million tonnes. The transfer of some coal-fired power plants to the grid reserve and the reserve for security of supply led to a reduction in emissions of 13.7 million tonnes. However, emissions increased in other areas, such as industry and transport, so that Germany emitted almost 905 million tonnes of greenhouse gas in 2017 (see Figure 1). Compared to 1990, this corresponds to a decline of 27.7 percent, where a doubling of this decline to 55 percent by 2030 is part of Germany’s climate goals (Source: UBA).

Figure 1: Greenhouse gas emissions in Germany from 1990 to 2017 in million tonnes of CO2 equivalent (source: UBA)
Companies rely on renewables and PPAs
In 2017, the Internet giant Google covered its electricity requirements completely with renewable energies for the first time. The company announced this in April (Source: Google). Through a series of PPAs that Google agreed on with wind and solar projects, the company was able to cover the electricity requirements of its data centers and IT infrastructure entirely from renewable energies. In 2017, the Group purchased 3 GW of generation.
Another solar project based on a PPA is being developed in Spain. Project developer Baywa Re and the Norwegian energy group Statkraft have agreed on the conditions for a long-term power purchase agreement for the “Don Rodrigo” solar park with 170 MW. The PPA has a timeframe of 15 years and a volume of 300 GWh of generation per year. This is not the only solar project to be built in Spain without state support. In addition to the almost 4 GW of projects that receive remuneration through tenders, there is a project pipeline of 29 GW. From the perspective of the Spanish Photovoltaic Union (UNEF), many of these projects will be based on PPAs (Source: PV-Tech).
Germany invested about a third less in renewable energies in 2017 than in 2016, but worldwide investments in renewables (excluding major hydropower projects) rose by two percent to just under 280 billion dollars. China in particular, with last year’s PV boom set a record of over 125 billion dollars, representing 45 percent of global investments.
Tenders still bring surprises
The fact that the tenders for renewable energies are still good for surprises is exemplified by the joint tender round in Germany, where wind and PV competed against each other for 200 MW. Before the tender on 1st of April 2018, the industry saw wind energy as the main winner of the joint tender. However, things turned out quite differently: photovoltaics won all the tenders and prevailed with a volume-weighted average award value of 4.67 ct/kWh. You can find our detailed analysis of this tender here.
Also the tendering process for offshore wind energy projects was not without major surprises. A capacity of 1600 MW was awarded with three projects each in the Baltic and North Sea. While the volume-weighted average surcharge standing at 4.66 ct/kWh, the surcharge values for the various projects differed considerably. Örsted (formerly Dong Energy) offered 0 ct/kWh for its 420 MW “Borkum Riffgrund West 1” and receives no remuneration, but has to refinance itself solely via the electricity market revenues. On the other hand, the Danish group has also successfully launched an offshore project with a bid of 9.83 ct/kWh (Source: Federal Network Agency). In general, the smaller projects in the offshore sector are characterised by higher surcharge values due to lower economies of scale in the installation of the turbines than large offshore wind farms.
Urgent reform of the KWKG and EEG
The Federal Ministry of Economic Affairs under Minister Altmeier intends to introduce a series of new regulations in the CHP and Renewable Energy Laws through a legislative procedure by the beginning of July 2018. New CHP plants are to be treated in the same way as existing plants and exempted from the EEG levy on their own electricity consumption. Following negotiations with the EU Commission, this regulation is to take effect retroactively as of January 1st 2018.
But there will also be changes in the EEG to be implemented before the summer break. In particular, this involves correcting the wind-onshore auction conditions, which require a quick solution. The privilege of civil energy companies to put bids into tenders without a federal immission control permit is to be finally abolished. Since the next onshore tendering round will take place on August 1, 2018, the rules must have been changed by then.
Furthermore, the maximum values for subsidies in auctions for solar and wind energy will be reduced. A maximum value of 5.7 ct/kWh should apply to wind onshore. Currently, the maximum value is 6.3 ct/kWh. The maximum value for PV is to be reduced from 8.91 ct/kWh to 6.5 ct/kWh,
However, the special tenders of 4000 MW for each wind and solar during 2019 and 2020 still mentioned in the coalition agreement are not to be found in the “100-day law”. This is particularly contested by the environmental associations, the Greens and the SPD, as the special tenders become less likely without setting the conditions soon. In this way, closing the climate protection gap for 2020 as quickly as possible would also be counteracted.
Electricity prices at 4.5 annual high
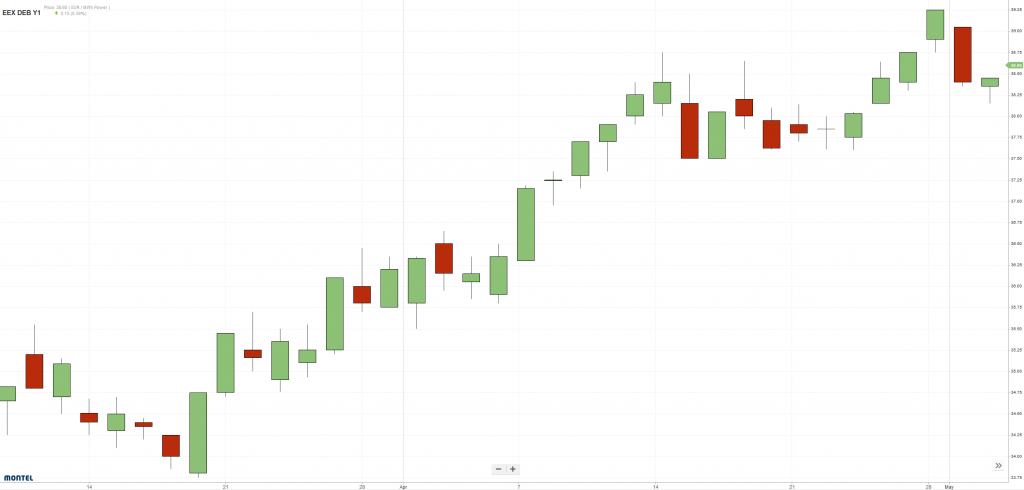
The futures market is quite bullish. The price for baseload deliveries in Germany for 2019 rose from 36 EUR/MWh to over 39 EUR/MWh in April and reached a new 4.5-year high on Monday 30th of April. There have been no such high forward market prices for Germany since 2013. Market participants mainly pointed to the strong coal market, which together with strong CO2-certificate prices pushed up electricity prices (Source: Montel). Even the 40 euro mark is no longer a no-go for some traders. The high oil prices of 75 USD/barrel also supported the other commodities. However, May 2018 fell sharply compared to the calendar year 2019: from over 33 EUR/MWh to just over 31 EUR/MWh towards the end of April 2018. Figure 2 shows the price development for baseload deliveries for Germany in 2019 from mid-March to the end of April.

Figure 2: Price development for front year delivery 2019 Base (DE) from mid-March to end of April 2018, (Source: Montel)
On the spot market, the strong generation from renewable energies was particularly noticeable. 12 percent of German electricity was generated by PV systems on average over April, while wind turbines accounted for 21 percent (source: PV Magazine). With high renewable capacity utilization, spot market prices for April were at a relatively low level at an average of 32 EUR/MWh. Figure 3 shows the quarter-hourly power generation of various generation technologies for Germany in April 2018.


