


Gross electricity consumption in China exceeded 6000 TWh for the first time in 2017. Installed capacities increased last year, in particular on the renewable side. PV capacities grew by 70 per cent.

The gross electricity consumption grew in 2017 by 6.6 per cent in comparison to 2016. This marks an increase of nearly 400 TWh to a total of 6308 TWh. The additional electricity demand is equivalent to roughly two third of the gross electricity consumption in Germany. High growth rates have been realized mainly in the service sector with over 10 per cent increases as well as the residential consumption. However with 4441 TWh the manufacturing industry used the majority of electricity in 2017 (Source: China Energy Portal).
The full load hours of thermal power plants increased by over 23 per cent compared to the record low in 2016. However, a capacity utilization of 4.209 hours cannot be called an efficient usage of the available capacities. Due to weather conditions in 2017, the full load hours of Chinese hydro power plants went down by approximately 40 per cent to 3580 hours (Source: China Energy Portal). At present, there is no data available regarding full load hours of renewable energy sources for the year 2017. The data at hand, dating until the third quarter of 2017 indicates a curtailment of wind and increasingly also photovoltaics in several provinces reaching again values between 20 and 30 per cent (Source: China Energy Portal).
The installed capacity of the Chinese power sector increased to 1777 GW until the end of 2017, whereby the major share of generation capacity was provided by photovoltaics and wind. Figure 1 shows the installed capacities per energy carrier as well as the additions in 2017.
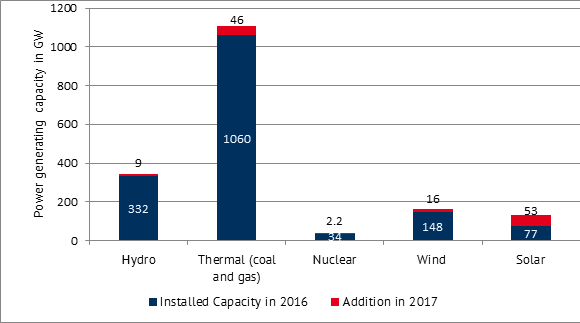
Figure 1: Power generating capacity in GW (Comparison of installed capacities in 2016 and additions in 2017) (source: Energy Brainpool)
Hence, 53 GW of photovoltaic capacity has been installed last year. This amounts to a growth of nearly 70 per cent and is almost 20 per cent more than what has been installed during the entire energy transition in Germany.
Definitely world record. At least until now.
Forecasts for installation rates for photovoltaics in 2018 expect the addition this year to range between 47 and 65 GW.
Figure 1 also visualizes the dominance of conventional thermal generation in the Chinese power sector. Renewable energy sources however marked the highest additional capacity installations in 2017.
Data on electricity generation of the different energy carriers for the entire year 2017 is not complete and finally published (preliminary numbers: China Energy Portal). The low full load hours of hydro power plants and the increased full load hours of thermal plants led to a generation of more than 4600 TWh by thermal fossil power stations in 2017. Despite the high growth of renewables, the share of electricity generation only changed marginally. In 2016, the share of renewables to the electricity generation stood at 25 per cent. For 2017, the increased gross electricity demand almost leveled out the additional generation from wind and photovoltaics. The share of renewable energies in the electricity generation stood at 26 percent in 2017, as figure 2 also demonstrates.
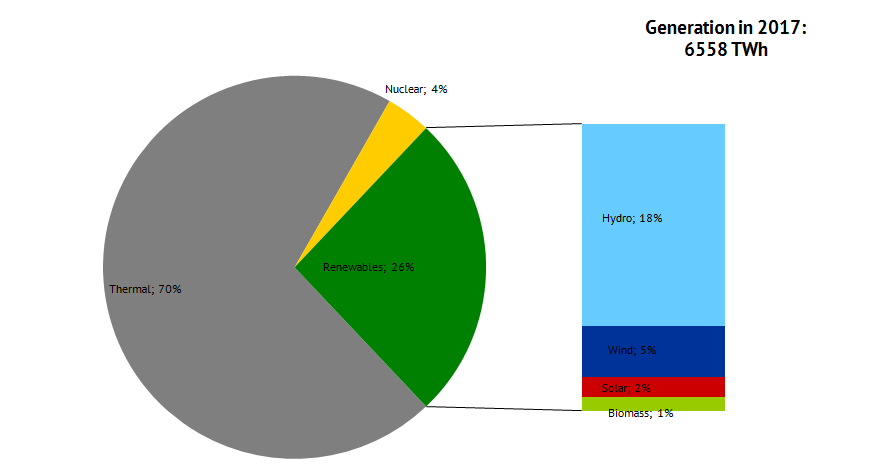
Figure 2: Annual electricity generation and share of different energy carriers in China 2017 (source: energy Brainpool)
Figure 3 and 4 show the changes in generation from 2016 to 2017 in per cent and in real TWh values. Especially solar stands out, where an increase of almost 80 % in electricity generation compared to 2016 materialized. The generation from thermal, fossil-fired power plants however only grew by 5 percent compared to the previous year.
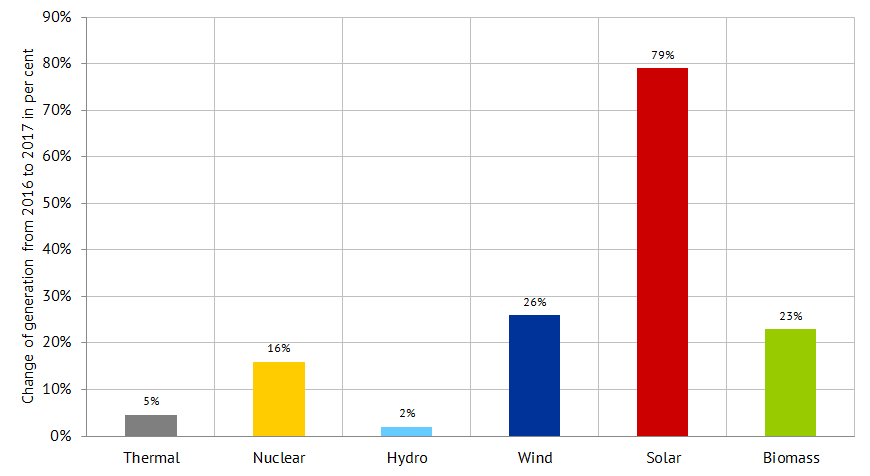
Figure 3: Percentage change in electricity generation of different energy carriers compared to the previous year in China in 2017 (source: Energy Brainpool)
Looking at the actual change in generation in TWh (Figure 4), the additional generation from conventional, thermal power plants (coal and gas) in 2017 compared to 2016 was higher than the one of all renewable energies combined. Comparing those numbers for the change between 2015 and 2016, it can be seen that renewables had a higher generation growth at that time. This effect was mainly due to higher generation from hydro power.
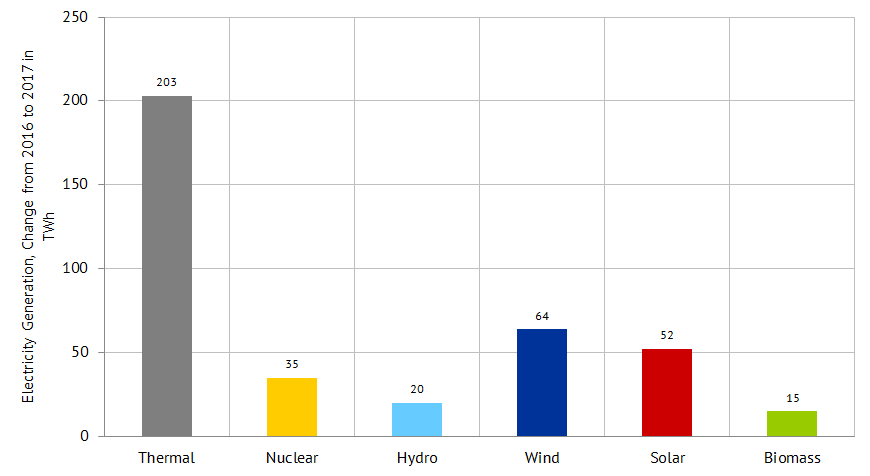
Figure 4: Change in electricity generation (TWh) of different energy carriers compared to the previous year in China in 2017 (source: Energy Brainpool)
Even these preliminary numbers show that the transition of the Chinese power system also continued in 2017. Both capacities and generation of all renewable energies have been growing during last year. However, the same is true for coal and gas. The Chinese target of having 110 GW solar energy capacity installed in 2020 has already been achieved in 2017.
For the next years, the primary focus will also be placed on reducing curtailment of renewables. Specifically, the introduction of short-run marginal cost based spot markets for electricity in China might alleviate this problem.