On behalf of Agora Energiewende and the China National Renewable Energy Centre (CNREC), Energy Brainpool investigated the Chinese power supply. It became clear that the power system is in a significant transition. The increasing regenerative supply is followed by stagnating CO2 emissions since 2013.
Economic growth and energy consumption are beginning to develop less in parallel which is not at least due to efficiency measures of the energy-intensive industry. While GDP has risen by 90 per cent since 2010, primary energy consumption has increased by just 20 per cent and thus energy intensity has declined (cf. Figure 1).
The electricity consumption in China has increased by 1,720 TWh since 2010. The increase was strongest in the trade and service sector (tertiary sector), the sector’s consumption grew by 78 per cent. This is a clear indicator that the service sector is developing to an important pillar of China’s economy. From 2015 to 2016, the electricity consumption grew by only 5 per cent in China.
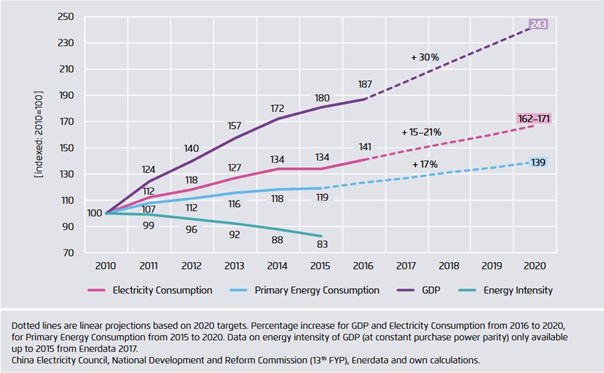
Figure 1: GDP, primary energy consumption, electricity consumption of GDP (at constant purchase power parity) 2010 to 2016 with goals for 2020 (indexed, 2010=100). Source: Agora Energiewende
At the same time, the role of renewable energies became more important. Since 2010, the share of renewable energies in the electricity mix has risen by 7 per cent, while the proportion of coal has declined by 11 per cent. China’s total electricity production rose by 5 per cent or 300 TWh, to 5,990 TWh. The European Union produced 3,211 TWh of electricity). (cf. Figure 2)
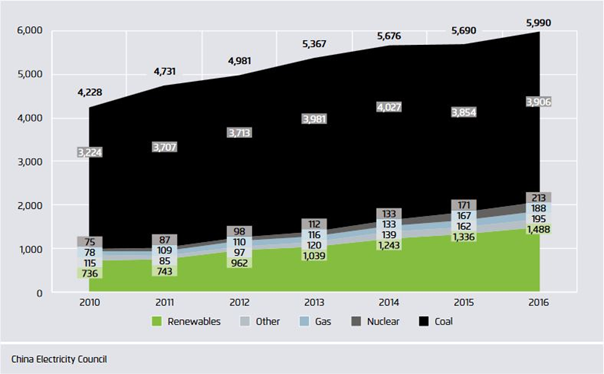
Figure 2: Annual power generation by energy source in 2010-2016: the share of power generation from renewables is growing faster than total power generation. Source: Agora Energiewende
With 65 per cent, coal accounted for the largest share of Chinese electricity while renewables made up 25 per cent. Power generation from coal grew by only 1.3 per cent in comparison to the previous year, whereas wind and solar energy skyrocketed with a growth of 30 and 72 percent, respectively. Nuclear energy (+24 percent) and natural gas (+13 percent) rose more moderately. Hydro power accounted for the majority of the renewable electricity generation (80 percent). Wind and solar are supported via a feed-in tariff and are becoming increasingly established. Wind accounted for 4 per cent and solar for 1 per cent of total electricity generation, as can be inferred from Figure 3.
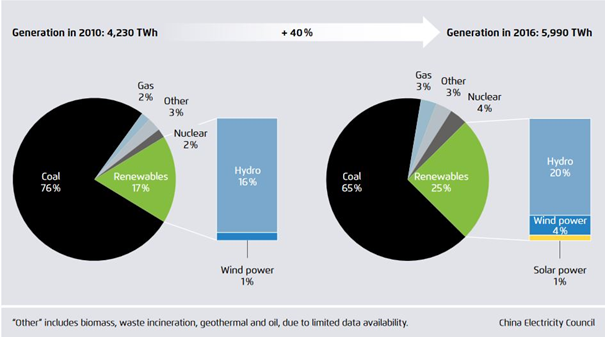
Figure 3: Power generation mix in China 2010 and 2016: while the share of coal is declining, the share of renewable is increasing. Source: Agora Energiewende
In 2016, 34 GW PV were installed in China setting a new worldwide record. The remarkable construction of new installations, also in the wind sector is not just an advantage. Most of the installations are located in the north-west of China and the consumption centers are in the East. Bottlenecks in the transmission grid occur more frequently. At the same time, the coal-fired power plants were guaranteed full load hours of operation. Both together lead to increasing curtailment rates, in 2016 an average of 17 per cent. For this reason, the expansion of renewable energies in some provinces, such as Gansu and Xinjiang is being slowed down.
In order to integrate the planned capacities shown in Figure 4 into the system, China is also focusing on a strong expansion of its electricity grid.
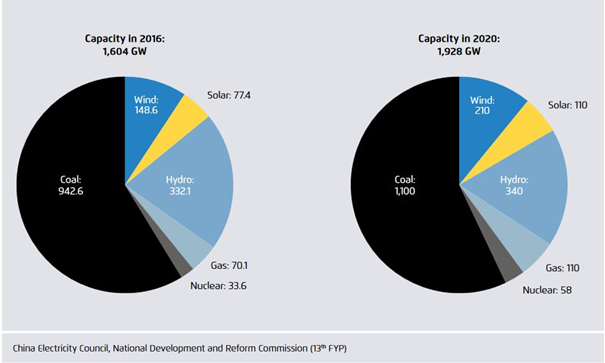
Figure 4: Installed generating capacities in China’s power sector in 2016 and 2020 in GW: a capacity increase of more than 20 percent, or more than 300 GW, is planned. Source: Agora Energiewende
The entire report in English can be downloaded here:


