While renewables were the largest source of new electricity generation on a global level, rising use of gas, oil and coal led to CO2-emissions being two percent higher in 2018 than in 2017. The disquieting truth about the global energy system: growing energy hunger outpaces renewable expansion. The increasing demand of 2.8 percent was primarily met by fossil fuels. This process puts climate goals to risk with the fastest growth of carbon emission in seven years.
Incremental growth fueled by fossil fuels
Also this year´s Statistical Review of World Energy published by oil major BP attracted a lot of attention. This report represents one of the most detailed worldwide energy statistics. The 2019 version came with many interesting facts and figures. Carbon Brief provides an in-depth summary here.
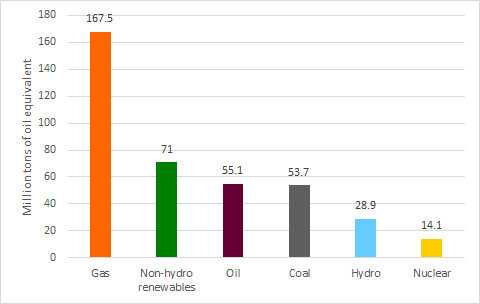
Foremost primary energy consumption growth with 2.8 percent in 2018 was the fastest since 2010. It reached double the rate of its 10-year average. All fuels grew faster, except of renewables, in order to supply the additional energy demand. Almost 45 percent of the energy supply growth came from natural gas. Incontrast, renewables accounted for the second largest increment as figure 1 depicts.
Viewed in total, energy supply growth from fossil fuels stood at 75 percent. Meanwhile the remaining quarter was supplied by renewables, specifically wind, PV and hydro.
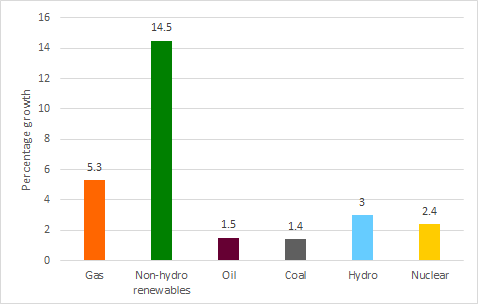
In terms of growth rates, renewables still came out first and grew by 14.5 percent compared to 2017. Non-hydro renewables accounted for four percent of global primary energy use in 2018. Gas supply grew by 5.3 percent, while oil and coal grew at low percentage points but from very high initial values. Figure 2 shows the percentage growth of different energy carriers in 2018.
More than two-thirds of the increase in energy demand came from China, the US and India. Especially the US has expanded its consumption by 3.5 percent, its fastest rate in three decades. The current shale gas boom in the US certainly fueled the growing energy consumption in the country.
Renewables grow most in electricity sector
With 3.7 percent growth, the electricity sector saw one of its strongest growth rates during the past 20 years. Almost half of the global primary energy growth in 2018 came from electricity generation. More than 80 percent of this growth has been driven by the developing world. Especially China and India were responsible for two thirds of total electricity demand increase.
On the supply side, renewable (including hydro) output grew by 442 TWh, roughly a third of the growth. While the remainder was mainly supplied by coal (31 percent of the increase) and gas (25 percent of the increase).
According to BP, one of the main reasons for the strong electricity demand in 2018 were the increase in both heating and cooling services in many countries due to weather effects. If the weather effects due to climate change will pan out to increase energy demand, trouble is suit to follow and a vicious cycle might develop. Even BP acknowledges this relationship and states that “the recent trends still feel very distant from the types of transition path consistent with meeting the Paris climate goals.”
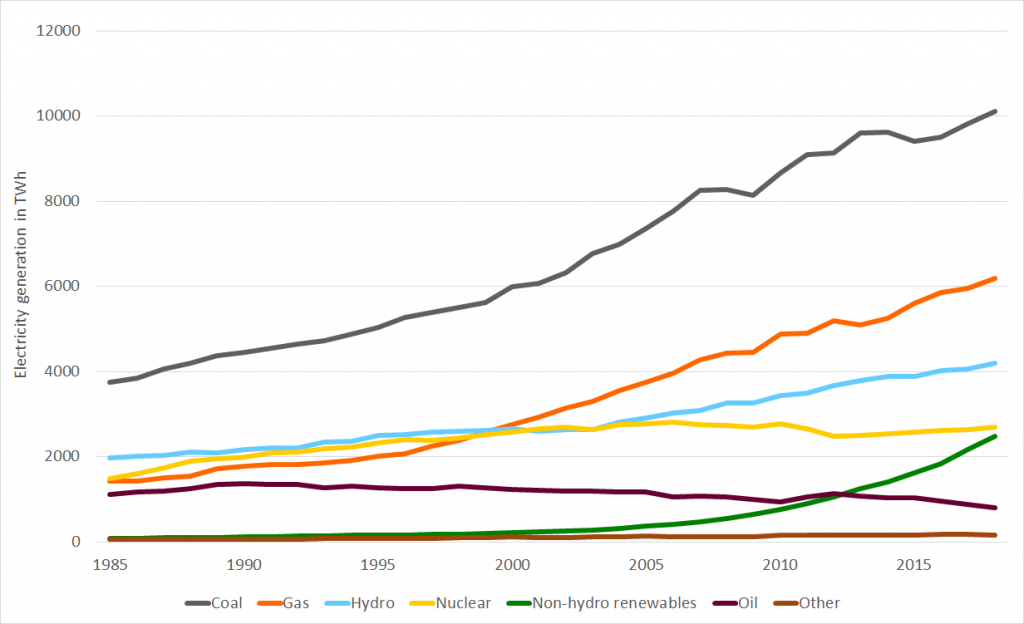
Despite the strong growth of renewables, the share of fossil fuels in global electricity consumption still stands at 64 percent, similar to the share during the period of 1985 to 2000.
Figure 3 exemplifies the electricity generation by different fuels since 1985 and brings home two main points: Renewables have been growing fast since 2005, while fossil fuels did the same and still provide the majority of all electricity globally.

Figure 3: global electricity generation since 1985 until 2018 by different fuels in TWh (source: Energy Brainpool)
CO2-emissions are not slowing down
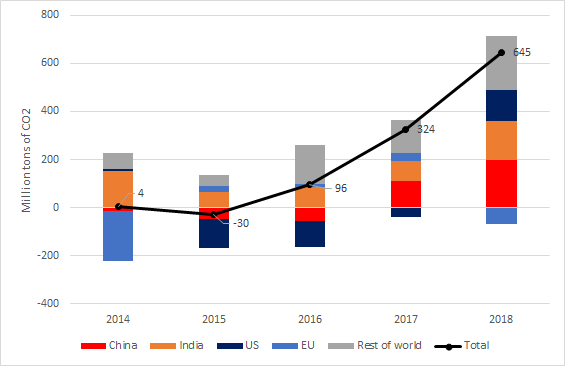
With the fastest growth of CO2-emissions since seven years, the world is far behind its aspirations of the Paris Agreement. While emissions have been growing more slowly since 2010 than in the decade before that, last year’s increase of two percent clarifies that a global emission peak is not in sight yet. The annual changes of energy-related CO2-emissions from the biggest polluting regions are depicted in figure 4 (data source: Carbon Brief).

Figure 4: annual energy-related CO2-emissions by key region in million tons of CO2 from 2014 to 2018 (source: Energy Brainpool, data source: Carbon Brief)
Figure 4 shows how the emissions of the US have been falling until 2017 (mainly due to a coal to gas switch). But they rose again in 2018. Whereas Chinese CO2 emissions grew again from 2017 after three years of modest decline. India’s and rest of world´s emissions however increased steadily since 2014. Only Europe showed a decrease in its emissions levels in 2018.
What is the take away?
The year 2018 showed record level of renewable energy supply, alongside with record gas consumption growth. CO2-emissions increased globally and there is no emission peak in sight, barring a reduction of emissions necessary for limiting global warming to two degrees Celsius.
The growth in energy demand was mainly driven by industrial activity as well as hotter and colder weather patterns. Consequently the latter might be more common due to climate change.
All in all, the BP Statistical Review 2019 is a stark reminder that the world is on an unsustainable pathway. This is especially true in terms of its energy supply and associated CO2-emissions, specifically due to growing energy demand, which is only partly met by renewables.


What do you say on this subject? Discuss with us!