With the current “EU Energy Outlook 2050”, Energy Brainpool shows long-term trends in Europe. The European energy system will change dramatically in the coming decades. What do current developments in the EU mean for electricity prices, revenue potential and risks for photovoltaics and wind?
The electricity markets in Europe are subject to constant change, which makes current price scenarios indispensable. This is the only way to assess market developments, assets and contracts, investment decisions, PPAs or business models correctly.
The “EU Energy Outlook 2050” shows the development of the “EnergyBrainpool”-scenario for EU-28, Norway and Switzerland. Actual processes in the individual countries can vary considerably. In order to make well-founded decisions, detailed modelling of the individual national markets and the influencing factors there, including sensitivity analyses, is essential.
What does the power plant fleet of the future look like?*

Figure 1: installed generation capacities in EU 28 (incl. NO and CH) by energy carrier; source: Energy Brainpool, “Energy, transport and GHG emissions Trends to 2050 – Reference Scenario 2016“ [1] , “TYNDP 2018” [3]
The current climate debate is having an effect, so that a total of ten EU-states have now decided to phase out coal in order to limit climate change. Well known and proven technologies are available for the future: gas-fired power plants, renewable energies and nuclear power plants.
Wind power and photovoltaics in particular continue to have great growth potential. These technologies are now competitive – thanks to the sharp drop in costs over the past ten years. This is also evident from the increasing number of PPA-based projects, especially for solar installations. Experts expect this development to continue.
In the “EU Energy Outlook 2050”, the share of these volatile renewable energies (vRES) will rise to around 59 percent of the total supply by 2050. Renewables account for 75 percent of the power plant fleet.
At the European level, gas-fired power plants will be the main source of controllable fossil generation capacity in the future. This is due to the lower emissions compared to coal-fired power plants. Even with carbon capture storage (CCS), the latter continue to lose importance.
The capacities of nuclear and coal-fired power plants will be reduced by more than 55 percent by 2050 Germany, France, Great Britain, Spain, the Netherlands, Finland, Italy, Ireland, Portugal and Denmark have announced coal exits for the future. As a result, the currently installed output of hard coal in particular will fall sharply to around 36 percent by 2030.
In overall terms, the share of generation capacity from controllable thermal power plants will be reduced from 50 percent to around 25 percent by 2050. This will have a considerable impact on the structure of electricity prices, which will increasingly be influenced by vRES prices.
Why does electricity demand rise until 2050?

Figure 2: gross electricity generation of generating technologies and gross electricity demand in EU 28 (incl. NO and CH); source: Energy Brainpool, “Energy, transport and GHG emissions Trends to 2050 – Reference Scenario 2016“ [1] , “TYNDP 2018” [3]
In the industrial sector, increased efficiency can prevent a significant increase in electricity consumption.
The amount of electricity produced from coal-fired power plants is declining sharply, falling by around 60 percent by 2030 and by around 95 percent by 2050. However, production from gas-fired power plants will increase by around 25 percent by 2050. Wind and solar power plants will generate around 45 percent of the electricity in 2050.
Around 36 percent of the electricity comes from controllable fossil-fuel power plants. The remaining electricity is produced by controllable, renewable energies such as biomass power plants or storage lakes. 79 percent of the electricity is generated emission-free. This would miss the climate targets that had been set.
The long-term development of commodity prices
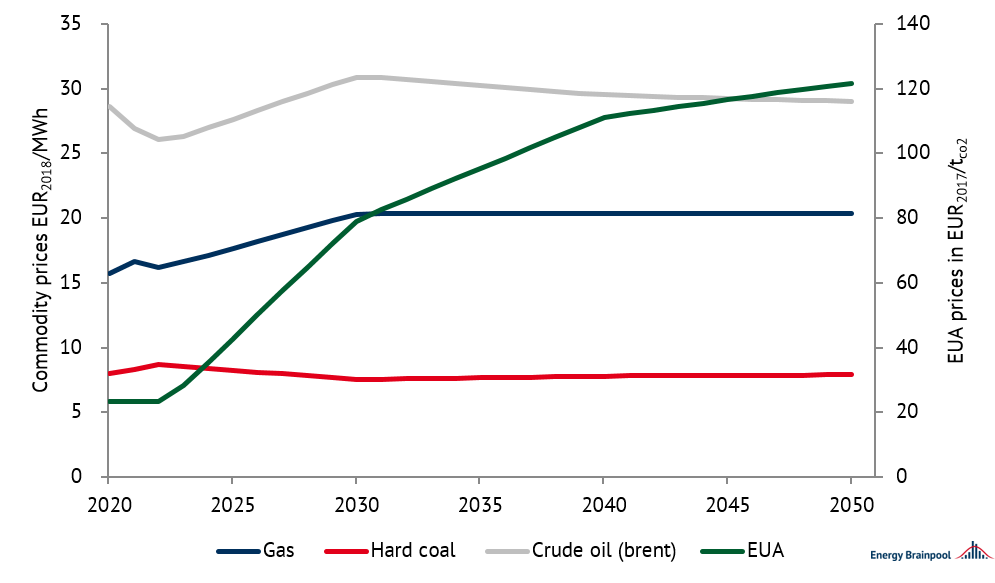
Figure 3: commodity prices, source: World Energy Outlook 2019 (“Sustainable Development”) and own calculations Energy Brainpool
The development of the most important commodities until 2040 is based on the “Sustainable Development” scenario of the IEA’s World Energy Outlook 2019 [2]. In this scenario, three goals are defined: the stabilisation of climate change, clean air and universal access to modern energy.
In this scenario, prices for CO2 certificates rise significantly. The prices for gas, oil and hard coal remain at a rather constant level. From 2040 to 2050, the development is an extrapolation.
The development of average electricity prices
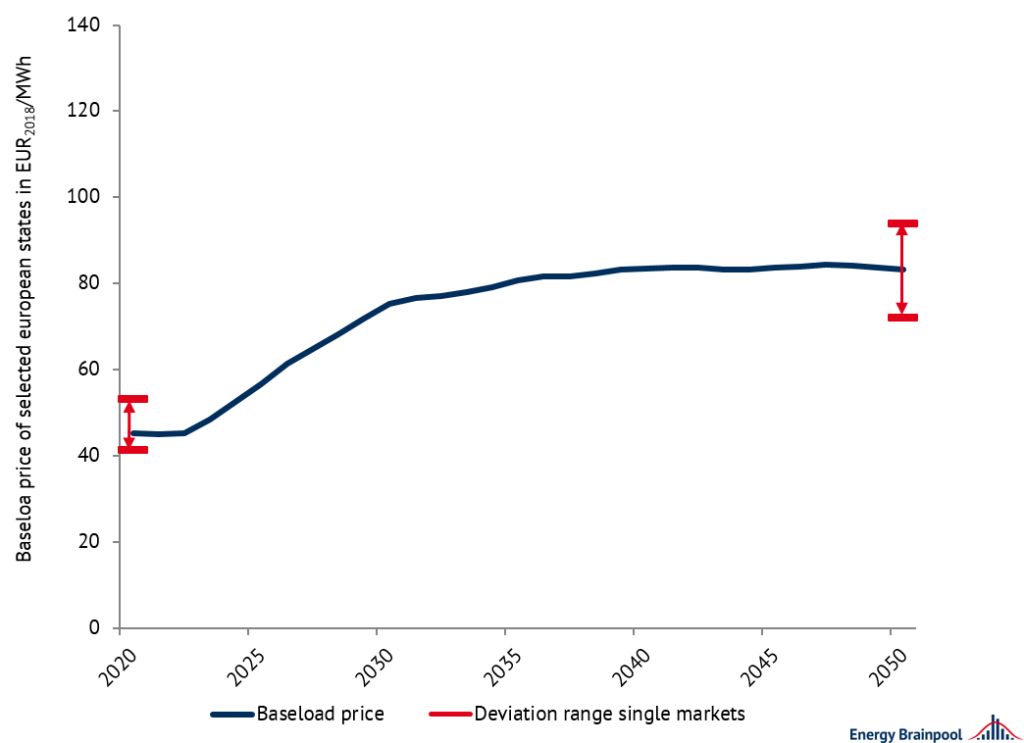
Figure 4: annual baseload prices and the range of deviations of national markets of selected countries in Europe on average, Source: Energy Brainpool
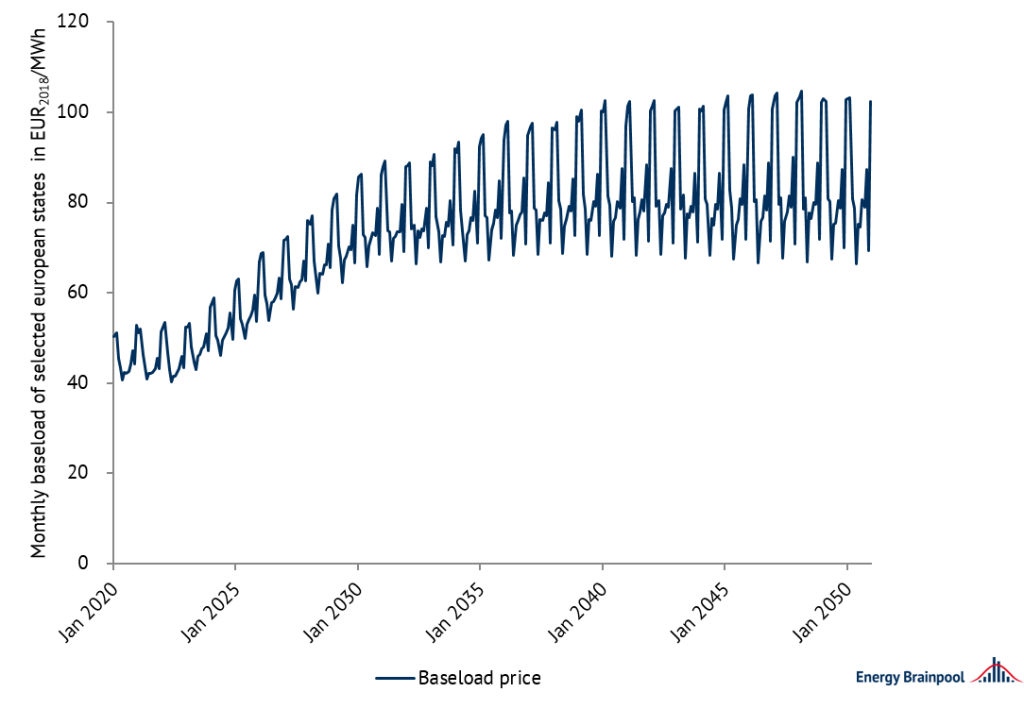
Primary energy and CO2 prices are of particular relevance for the development of average, unweighted electricity prices between 2020 and 2040. From 2040, electricity prices will stagnate despite rising gas and CO2 prices. The reason: High feed-ins from wind and photovoltaic power plants, which can only partially be offset by an increasingly flexible demand for electricity, will increasingly lead to low and, more frequently, negative electricity prices.
The actual developments in the individual countries differ, in some cases very significantly, from one another. This is shown by the fluctuation margins shown. In particular, countries with little expansion of renewable energies are recording a steady rise in electricity prices (due to the development of commodity prices).
If we look at power prices on a monthly basis, we can see the seasonality and volatility of the power market. For the winter, the analyses show rising prices due to the temperature sensitivity of electricity demand.
On the other hand, electricity prices are usually significantly lower in the summer. This effect is reinforced by the increasing share of solar power generation, which has a price-reducing effect.
What revenues can wind turbines achieve?

Figure 6: average sales values and volumes of wind in selected EU countries, source: Energy Brainpool
The sales value is the average volume-weighted electricity price that wind power plants can achieve on the spot market. Only generation hours with positive electricity prices are taken into account (including 0 EUR/MWh). By 2030, the sales value of wind energy will rise more strongly and then stagnate due to further increases in capacity.
Simultaneous generation reduces electricity prices in these hours (merit order effect). The sales volumes (share of generated volumes at electricity prices >= 0 EUR/MWh) will decline only slightly on average in the EU. And in some countries they will also decline very significantly. Sales revenues result based on the product of sales values and sales volumes.
Despite the high share of renewable energies, the high number of hours during which steerable fossil-fuel power plants set the price makes rising positive revenue streams possible. The fluctuation range of the markets shows how different the country-specific average revenue opportunities of wind turbines are.
Energy Brainpool defined, among other things, the indices sales value and volume in the white paper “Valuation of electricity market revenues of fluctuating renewable energies“. These indices enable a realistic determination of the revenue potential of fluctuating, renewable energies in the electricity market.
What revenues can photovoltaic systems (solar) achieve?
The development of sales values for solar energy is in line with the trend for sales values for wind energy, but at a lower level. The reason for this is the significant simultaneity effect of solar energy: the majority of electricity is generated during the day in summer. In hours when a lot of solar power is generated, the price of electricity and thus the revenues fall.
To sum it up, the sales volumes for solar energy are also declining only slightly on average in the EU, but very significantly in specific countries. The large fluctuation margin of the solar sales values in the individual countries shows how strongly the revenue opportunities vary.
Here, however, it should be noted that in a sunny country high revenues are possible even with low sales values. The reason for this is that the plants are operating at better utilisation rates.
Solar thermal plants for electricity generation are a marginal technology in the scenario and are not being expanded on a large scale.
Increase in price volatility in detail
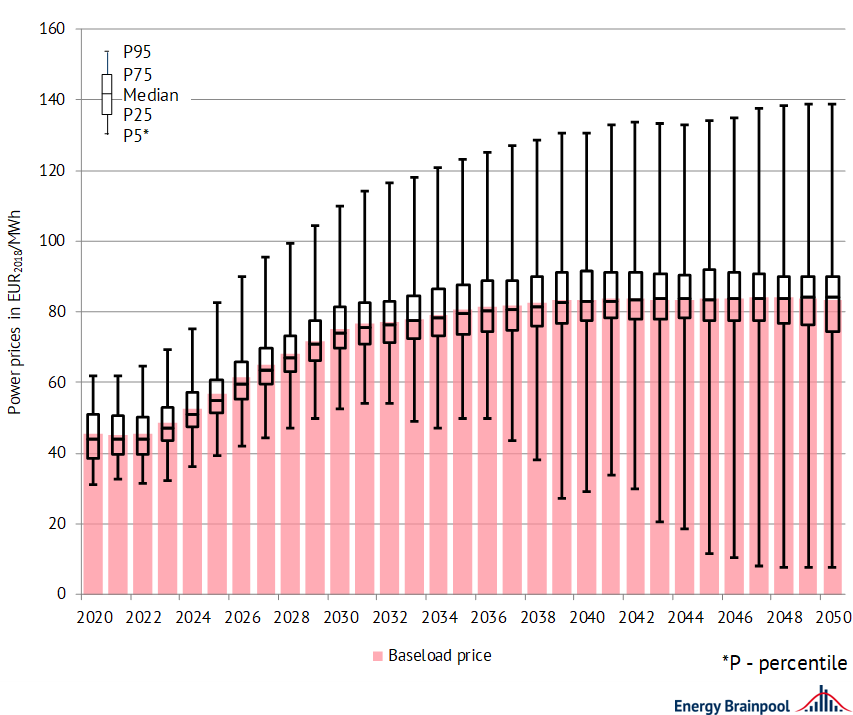
Figure 8: number of positive and negative extreme prices on average in selected EU countries, source: Energy Brainpool
In the scenario, many factors lead to a significant increase in price volatility. On the one hand, the generation costs of steerable fossil-fuel power plants are rising due to the development of commodity prices. On the other hand, the expansion of fluctuating renewable energies has a price-reducing effect.
As a result, extreme prices occur much more frequently from today’s perspective and become a normal part of the electricity price structure of the day-ahead market.
National capacity-specific revenues from fluctuating renewable energies
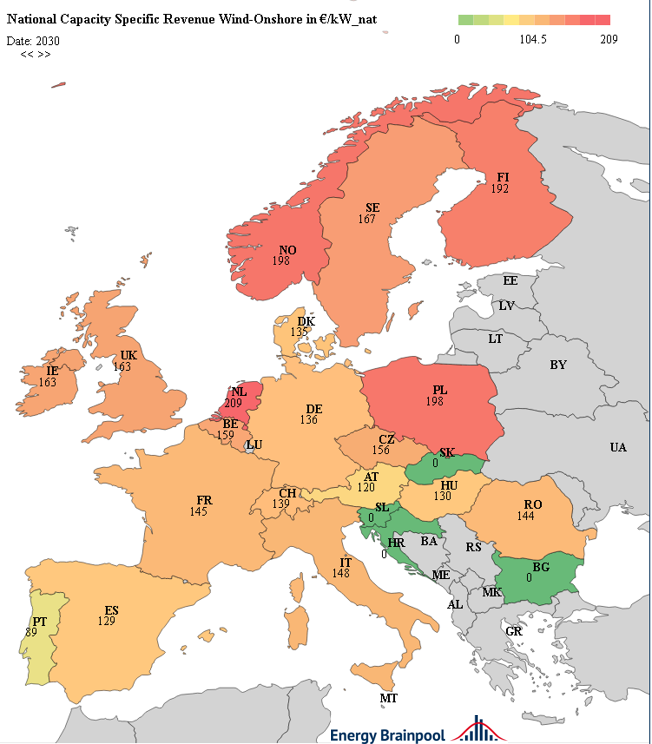
Figure 9: national capacity-specific revenues onshore in 2030 in EUR2018/kWnat of chosen European states, source: Energy Brainpool
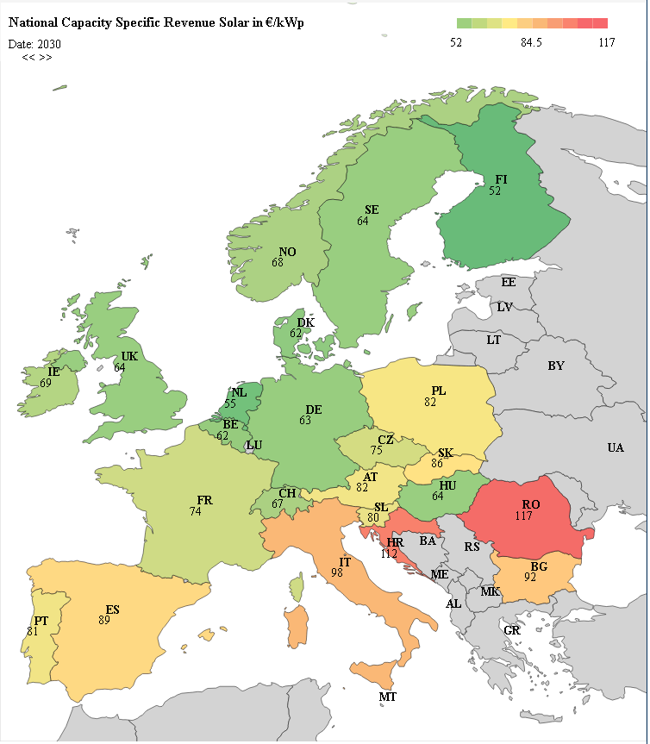
Figure 10: national capacity-specific revenues solar in 2030 in EUR2018/kWp,nat of chosen European states, source: Energy Brainpool
At which locations and countries or in which technology should investments be made? On the one hand, the average revenues of fluctuating renewable energies must be taken into account by means of the sales value in EUR/MWh and, on the other hand, the annual energy output of the respective technology and location must also be taken into account.
This is made possible by the capacity-specific revenue. It represents the respective average revenues per installed kW. By looking at the average sales values in EUR/MWh it seems like that a PV system in Spain generates less revenues than a PV system located in the UK.
However, this is put into perspective by the high capacity utilisation and thus full load hours in Spain, so that the system ultimately generates more revenue per kW than in the UK. Such a parameter can, of course, also be determined for a specific location.
Eventually, the results show that wind turbines are more likely to generate higher revenues in Northern European countries. Whereas solar systems are more likely to have a revenue advantage in Southern European countries.
Fluctuations due to weather risks
In Germany and other European markets, due to the subsidies of wind and solar power, the focus so far was solely on the influence on the quantities produced, in case of the weather risks associated with fluctuating renewable energies. The guaranteed feed-in tariff and market premium meant that all price risks were irrelevant.
For example for wind turbines, this meant that high wind volumes generated high revenues and little wind led to low revenues. In order to estimate revenues, an expected quantity (e.g. P50 quantity) was consequently multiplied by the fixed subsidies.
However, this situation changes for the increasing number of generators that sell their electricity on the market without any subsidies. Their revenues are now based on volatile electricity prices. Since these prices are also affected by weather, we have to consider weather impacts in both volume and price respects.
Herein, we will demonstrate the existence of an anti-correlation between the two weather effects, which tends to stabilise revenues and reveals that weather risks are prone to systematic overestimation.
This anti-correlation is illustrated by the modelling results of a scenario calculation for the year 2021 using the weather years 2005 to 2016. Figure 1 shows the percentage fluctuations in producible volumes and sales revenues around the respective mean value. Multiplying the producible volume (in MWh) by the sales revenue (in EUR/MWh) gives the yearly revenues of the plant (in EUR/MW/a).
Their deviations from the mean value are given as percentages as well as in EUR/MWh. Basically, they refer to revenue fluctuations of the produced volumes that are expected on a long-term average (i.e. p50-volume).
A glance at the figures reveals a pattern: windy years show high volumes with low sales revenues, windless years show low volumes with higher sales revenues. This can be traced back to the cannibalisation effect of renewable energies, which can help stabilise annual revenues.
For example, producible volumes in the weather year 2007 are more than 16 percent above the p50-value, but sales revenues in EUR/MWh are 8 percent lower. The annual revenue of the plant therefore fluctuates only by + 7.5 percent. This translates into + 3.12 EUR/MWh deviation from the revenues planned with the p50 volume as the long-term average.
In contrast, producible volumes in the weather year 2010 will be 10 percent lower, which corresponds roughly to the p90 volume. Basically, the lower volumes are more than offset by the rise in sales revenues of over 11 percent, and annual revenues remain stable (plus 0.7 percent).
However, if expected revenues of a plant are calculated through multiplication of the p90 volume (of the weather year 2010) by the average sales revenue only, the weather risk is systematically overestimated and the stabilising anti-correlation is ignored.
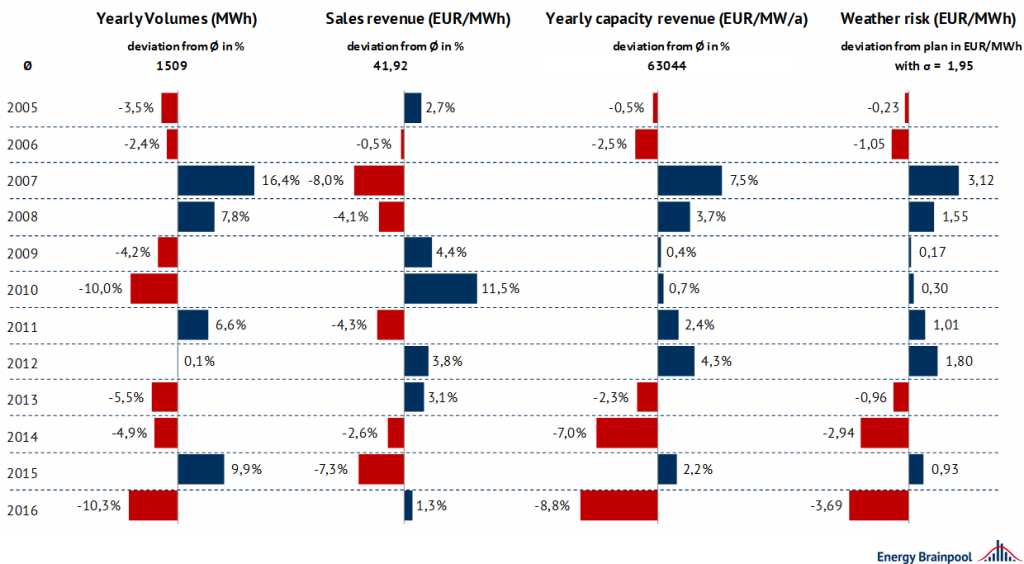
Figure 11: comparison of the influence of different weather years on producible volume and sales revenue in 2021, depicted as percentage deviations from the mean value of all weather years, source: Energy Brainpool
When comparing the weather years 2010 and 2016, however, it also becomes clear that this anti-correlation is not equally present in every weather year. It can be cancelled out by simultaneous solar feed-in. For example, in 2016, despite low annual volumes, wind power feed-in was distributed more strongly over hours with simultaneously high solar feed-in than in 2010, so that sales revenues hardly increased at all.
Overall, there are weather year specific fluctuations in revenues that reflect both weather-related volume and price risks. If the volumes of p90 (e.g. 2010) or p50 weather years (e.g. 2009) are used to estimate weather risks, it is advisable to consider these in combination with expected price effects. Otherwise, weather risks may be overestimated.
The values presented will change significantly in the future due to changing power plant parks and thus changing cannibalisation of renewable energies.
Read more in our white papers “Power-Purchase-Agreements I & II”.
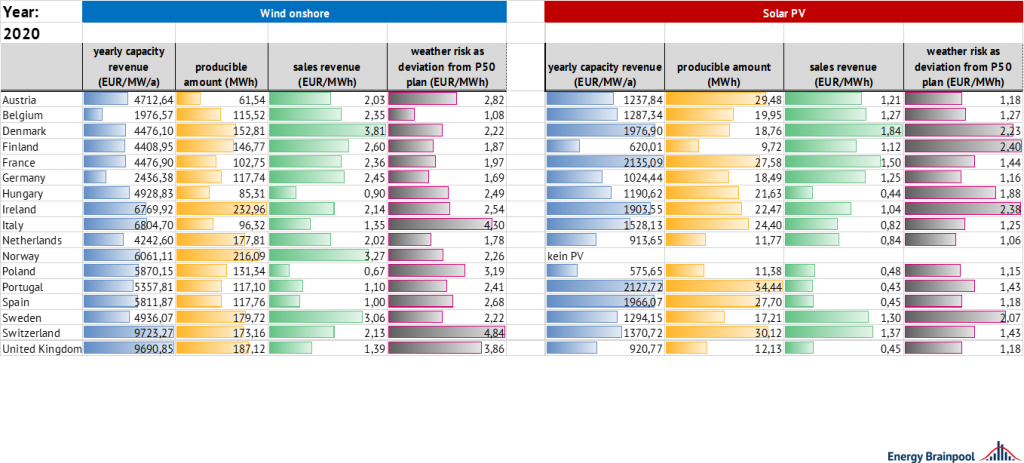
Figure 12: comparison of weather risks in different markets in 2020 using the weather years 2005-2016
Fluctuations due to different scenario assumptions
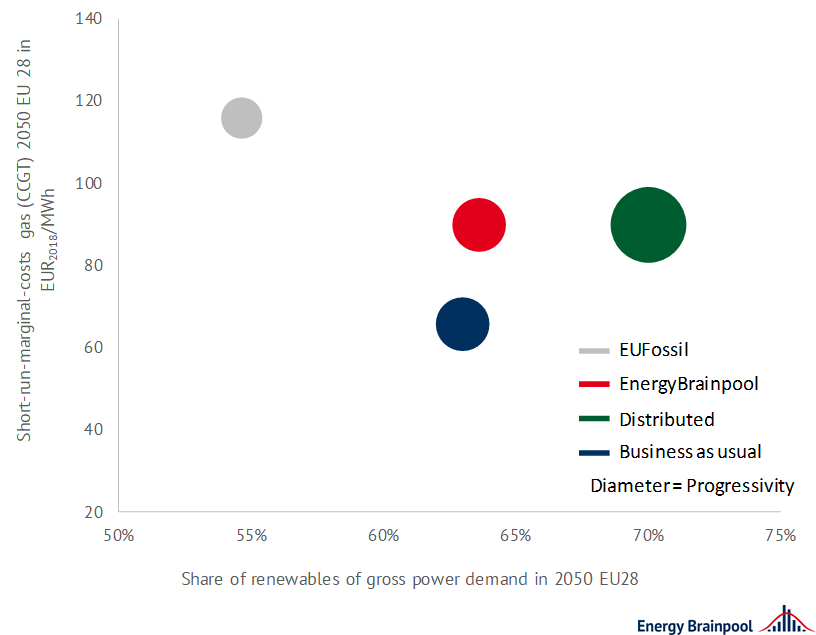
Energy Brainpool offers a variety of different scenarios. Figure 11 shows the different trends of the scenarios. The fluctuations relate both to the assumptions on the development of commodity prices, the power plant fleet, e-mobility and other flexibility options.
Figure 12 shows the corresponding results of the electricity prices of the respective scenarios.
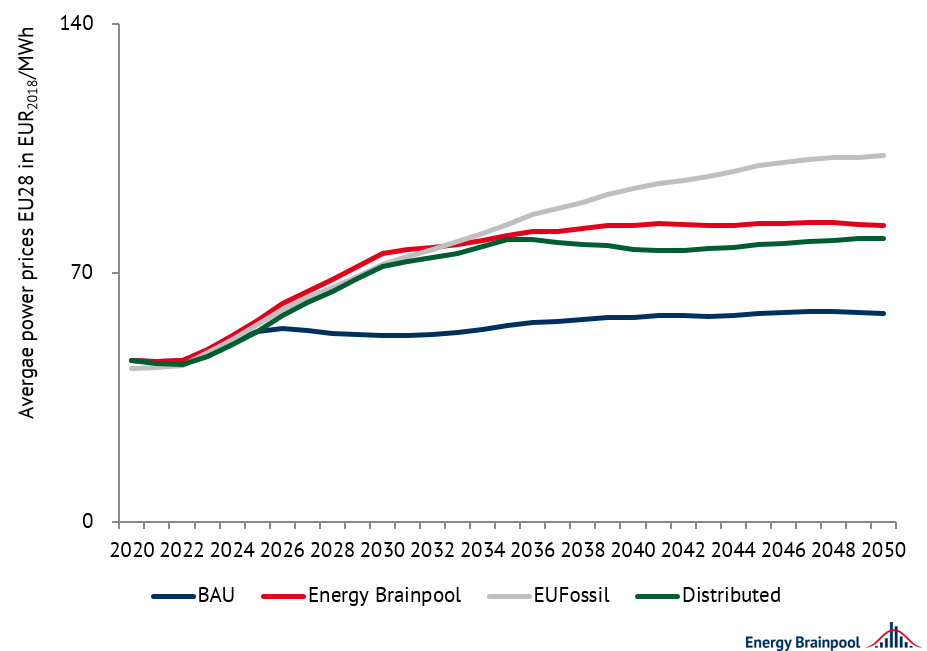
Figure 14: development of power prices in EUR 2018/MWh of the respective scenarios of selected EU states, source: Energy Brainpool
* EU-28 incl. Norway and Switzerland, depending on the evaluation, only the most significant states were selected to determine the mean.
Read more about the first issue of EU Energy Outlook here.
[1] https://ec.europa.eu/energy/sites/ener/files/documents/ref2016_report_final-web.pdf




What do you say on this subject? Discuss with us!