On a quarterly basis, we take a look at the theoretically achievable sales revenues of onshore and offshore wind turbines as well as photovoltaic systems and we analyse the respective background.

How are sales values and sales revenues for wind and PV determined? It is very important to understand this considering the expansion of variable renewable energy (vRE) systems without support from fixed feed-in tariffs. Whoever wants to sell electricity from vRE plants freely on the market, must know the expected market prices. Moreover, the revenue potential of the respective plant portfolio depends on a combination of market prices and the time series of power generation.
The White Paper “Valuation of revenues from fluctuating generation” defines the parameters used here in this article (sales value, sales volumes, sales revenue) in more detail.
Development of the sales values in Q4 2019
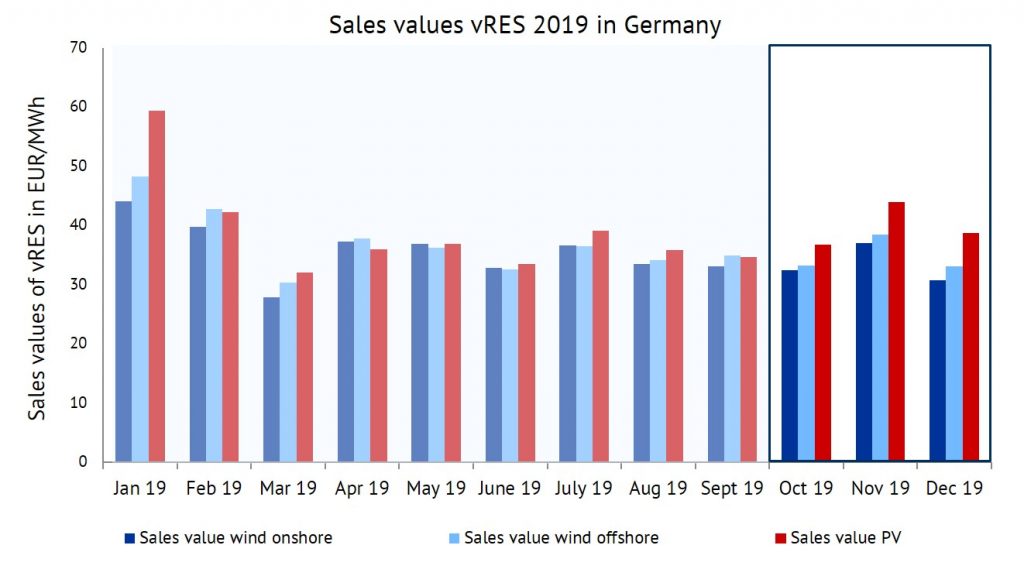
The sales value indicates the volume-weighted, average electricity price of a vRE technology, taking into account only periods in which the electricity price at the power exchange is greater than or equal to zero.

Figure 1: sales value of wind onshore, wind offshore and PV in 2019 in EUR/MWh. (Sources: Energy Brainpool, EPEX SPOT, ENTSO-E Transparency)
The monthly sales values of wind and PV differed more strongly in Q4 2019 than in Q2 or Q3. PV always had the highest sales value during Q4. In the winter months, peakload prices (8-20 hrs) are typically higher and differ more from baseload prices (around the clock) than in summer. This is good news for the sales value of the PV systems, as they only feed into the grid during the day. In nine months of 2019, the sales value of wind onshore was below the sales value of wind offshore.
Looking at the technologies individually, it can be said that the sales value of PV in Q4 improved significantly by 9 percent compared with Q3. Wind, on the other hand, showed a slight deterioration (-2.8 percent onshore, -0.7 percent offshore in Q4 compared to Q3).
Compared to the same period of the previous year (Q4 2018), all VRE technologies show a significant decline in the sales value of around 30 percent each. One important reason for this is that the average base price for the quarter was approximately 31 percent lower than in the same quarter of the previous year. (see below for more information)
Development of generation and sales volumes in Q4 2019
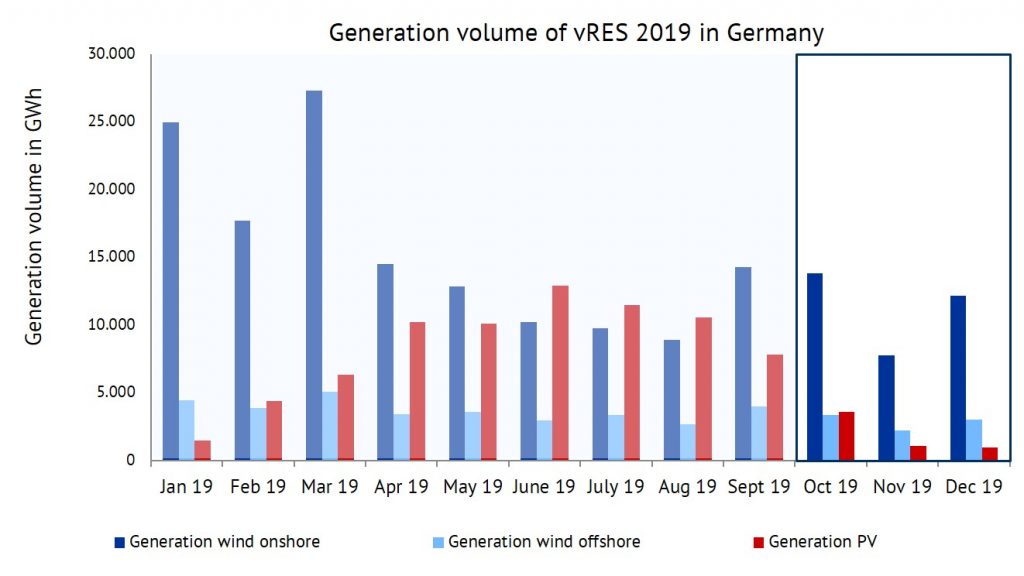
The generation volume is the sum of all units of electricity produced in GWh over the period under consideration. However, the sales volumes only take into account those quantities of electricity generated that could be sold at electricity prices greater than or equal to zero. The sales volumes shall be expressed as a percentage of the generation volume.

Figure 2: generation volume of wind onshore, wind offshore and PV in 2019 in GWh. (Sources: Energy Brainpool, ENTSO-E Transparency)
As expected, PV generation volumes in Q4 are lower than in the summer quarters (minus 81 percent compared to Q3), but in Q4 2019 they are also 37 percent lower than in the same quarter of the previous year. This seasonality for PV is clearly visible in Figure 2, however, for wind it is less pronounced.
The generation volume for wind onshore remained almost constant in Q4 compared to Q3, but compared to the same quarter of the previous year, it also dropped significantly by 41 percent. For wind offshore, a decline of 14 percent compared to Q3 2019 and 33 percent compared to the previous year is evident.
Despite the relatively low generation volumes in Q4, the generation volume of all VRE increased by 58 percent for the whole of 2019. Due to high PV add-on rates, a good wind year in general and lower overall electricity generation (due to lower demand), the share of renewable energies in electricity generation increased significantly to over 42 percent. [1]
In November 2019, marketing volumes were 100 percent, as there were no negative electricity prices. For October 2019, the marketing volume for wind onshore was 98.6 percent due to negative electricity prices in the night to 27 October 2019. December even had a whole series of negative electricity prices – not only on 23/24 December, but very clearly also on 8 December 2019.
At that time, a massive wind front was over Germany, generating an average of over 30 GW of electricity, as also described in the December 2019 market review.
Compared to the previous quarter, the sales volume for wind has slightly decreased (wind onshore -0.6 percent, wind offshore -0.4 percent), but for PV it has slightly increased (+1.3 percent). Compared to the same period of the previous year, sales volumes have fallen by approx. 0.8-1.8 percent. Hence, occurences of negative prices have increased slightly.
Baseload prices and sales revenues of PV and wind in Q4 2019
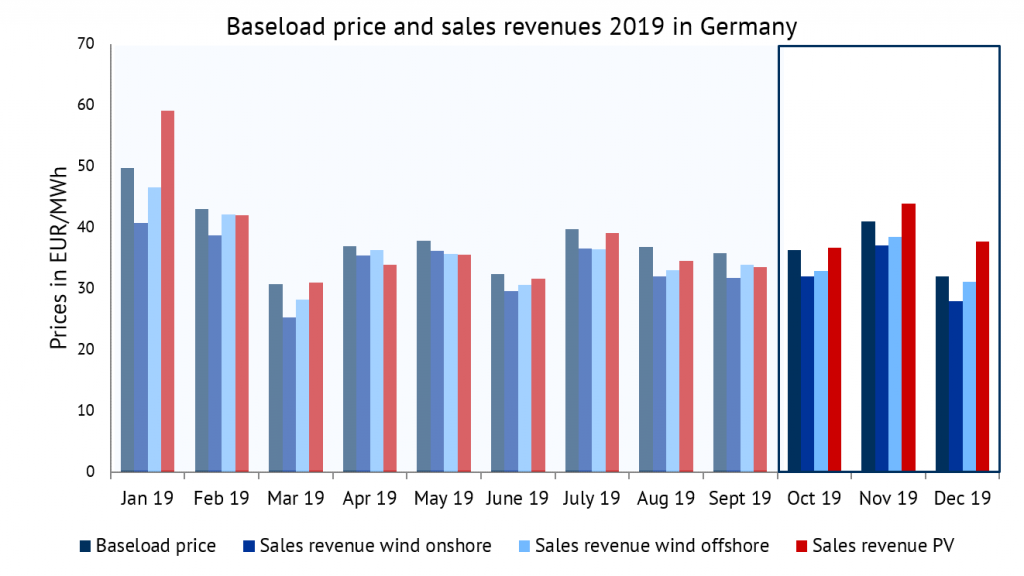
The sales revenues describe the technology-specific average revenues of the vRE plants in Germany. They are calculated as the product of the sales value and the sales volume. The baseload price is the average price (non-weighted) of the day-ahead auctions at EPEX Spot power exchange.

Figure 3: development of baseload prices and sales revenues of wind onshore, wind offshore and PV in 2019 in EUR/MWh. (Quelle: Energy Brainpool, ENTSO-E-Transparency, EPEX SPOT)
Figure 3 shows the comparison of monthly sales revenues and baseload prices. Historically, the baseload price in Germany has always been lower in summer than in winter, as demand is higher in winter. However, the increase in the number of VRE plants has repeatedly broken this pattern. The relatively low baseload prices in December 2019 are partly the result of high wind power generation. However, prices could have been even lower if the wind supply had been greater during the Christmas holidays until New Years’s Eve when demand was weak.
In November, the share of wind energy in power generation was rather low, so that coal and gas power plants were used more frequently and peak prices of over 70 EUR/MWh arose at times.
On a quarterly average, baseload prices in Q4 2019 were about 3 percent lower than in Q3 and 31 percent lower than in the prior-year quarter. After electricity prices had risen steadily in 2018, baseload prices in 2019 were about 15 percent lower than in the year before. Lower demand throughout the year, low gas and coal prices, and stagnating CO2 certificate prices are the main reasons.
Monthly sales revenues for PV in Q4 2019 were always above the baseload price, in contrast to 7 other months of the year. The lack of cannibalization of PV systems during the winter months with little sunshine led to this result. Consequently, the marketing revenues of Wind Onshore and Wind Offshore were always below the baseload price in Q4. The cannibalisation effect plays a key role here.
With large wind fronts, the price on the electricity exchange is massively depressed and the kilowatt hours fed in from the wind turbines have a low value. Since offshore wind turbines have less generation capacity and a more constant feed-in profile, cannibalisation does not (yet) have such a strong impact here.
External sources:
[1] Agora Energiewende, Annual Review 2019: https://www.agora-energiewende.de/presse/neuigkeiten-archiv/co2-preis-drueckt-treibhausgasemissionen-und-kohleverstromung-2019-auf-rekordtiefs/


What do you say on this subject? Discuss with us!