


As already experienced in the past years negative power prices also occurred during the Christmas days of 2016. In total there have been 35 hours with negative prices on and around Christmas going down to -67 €/MWh. Low negative prices are mainly a product of low power demand, high wind power generation and inflexible must-run capacities.

According to Montel more than one third of all 97 negative hours of the year 2016 have been falling into Christmas time. Compared to last year, in 2016 there have been 28 hours with negative power price more during this time. Figure 1 shows the strong slump in daily average prices during the month of December 2016.
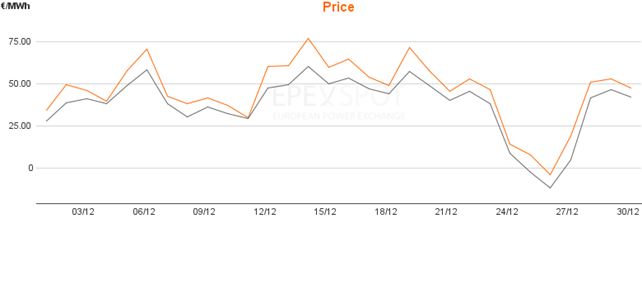
Figure 1: Daily power price in December 2016, Base (grey) and Peak (orange). Source: Epex Spot
Between 24th and 27th of December 2016, power on the Day-Ahead market has been sold for less than 0 €/MWh on 35 hours. On Boxing Day 15 out of 24 hours settled in the negative area. On that day not only the base delivery with -12.25 €/MWh went below zero, but the peak delivery (hours from 8am to 8pm) with -4.24 €/MWh did as well (Source: Montel). Figure 2 depicts the hourly prices of 26th of December 2016 on the Day-Ahead market at EPEX Spot.
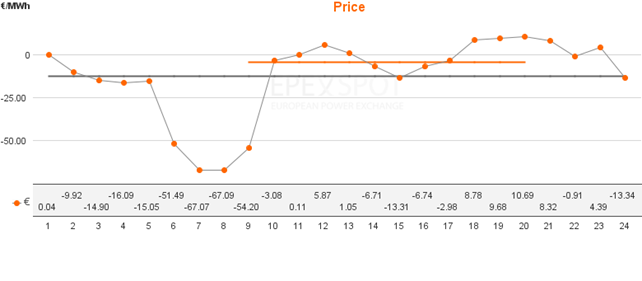
Figure 2: Day-Ahead power prices of 26.12.2016 (Source: Epex Spot)
Considerable price differences of trades for the same hour are discernable when looking at the Intraday-market for power prices on 25th and 26th of December (Figure 3). The analysis of the spread between different trades of hour 3 in the night of 25th to 26th shows a low price of -185 €/MWh and a high price of just below 1 €/MWh. This exemplifies that significant differences in the evaluation of the actual value of power in that hour materialized during the trading time of hour 3 on the Intraday-market.
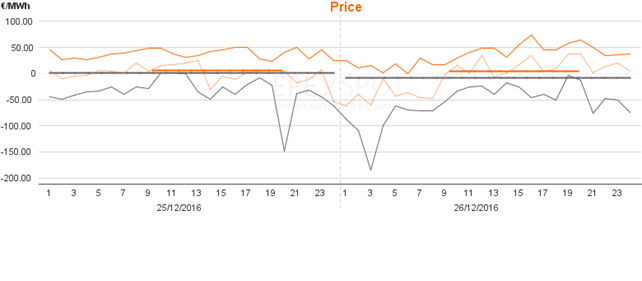
Figure 3: Intraday power prices on the Christmas holidays 2016, lowest (grey) and highest (orange). Source: Epex Spot
Main reasons for the negative power prices between 24th and 27th of December are a strong wind power feed-in of almost 30 GW during that period and the lower power demand during the holidays. Figure 4 shows the power generation by different sources during December 2016 and clearly indicated that during Christmas time up to 50 percent of German electricity has been generated by wind energy.

Figure 4: Power generation of different technologies in Germany during December 2016 (in percent). Source: Fraunhofer ISE
According to Fraunhofer ISE almost 70 percent of the German electricity demand has been provided by renewables. At the same time data of Agora Energiewende also show, that the low negative prices only occurred when low power demand coincided with high wind power generation, and were thus not only caused by wind power (Figure 5).
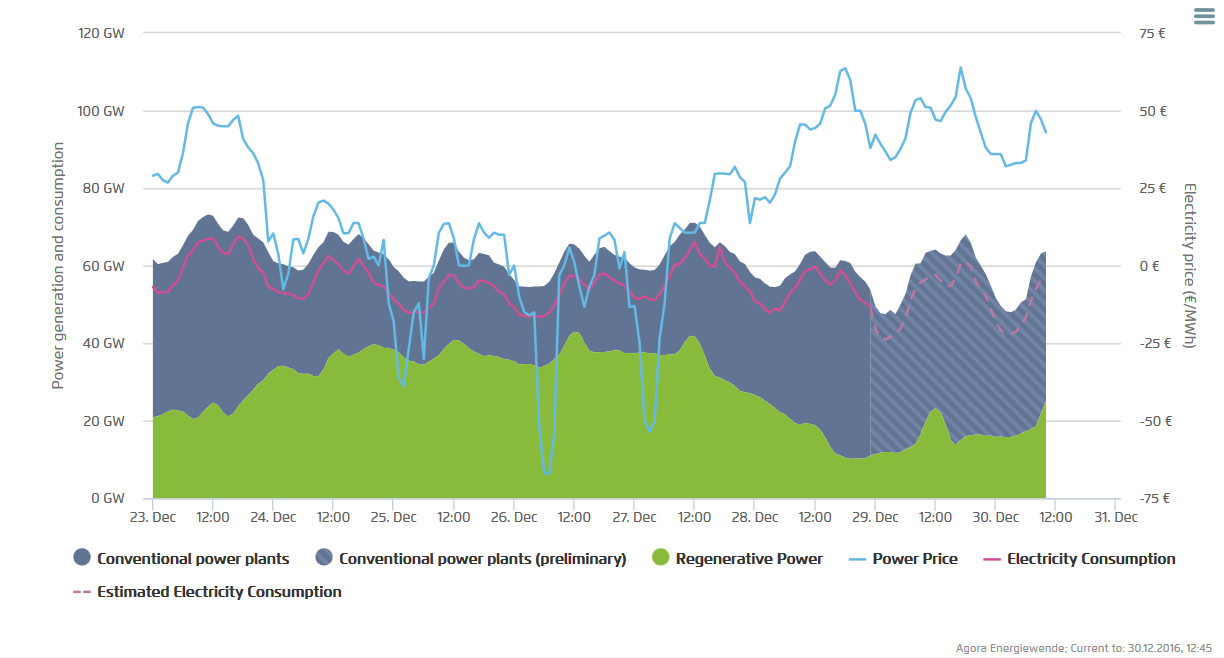
Figure 5: Generation (grey and green), power consumption (red) and power prices (blue) during Christmas 2016 (Source: Fraunhofer ISE)
Strong decline in power prices is especially noticeable when power demand is lower than 50 GW. This indicated amongst other things that a high share of inflexible must-run capacities (e.g. power plants with balancing power obligations or combined-heat-and-power plants running heat- and not power-driven) is not able to change its own power generation at times of high renewable energy feed-in into the German grid. Those must-run power plants rather incur negative power prices than reducing the own power generation partially or completely.