After photovoltaic (PV) PPAs have already established themselves in Southern Europe in recent years, the ball is rolling in Germany as well. While current market conditions indicate that PV PPAs will play an increasingly important role in the course of the energy transition, the question of “fair value” – the price that is fair to all sides – is increasingly being asked. It quickly becomes clear that consistent, long term electricity market scenarios are indispensable when assessing key performance indicators.
A flash in the pan or a long-term trend – what is the current state of PV-PPAs?
Audax signs the “world’s largest” PV-PPA for 660 MW “1 or “Another large PV-PPA for 300 MW decided in Italy “2. These are impressive headlines that we have heard in recent years, especially from Southern Europe.
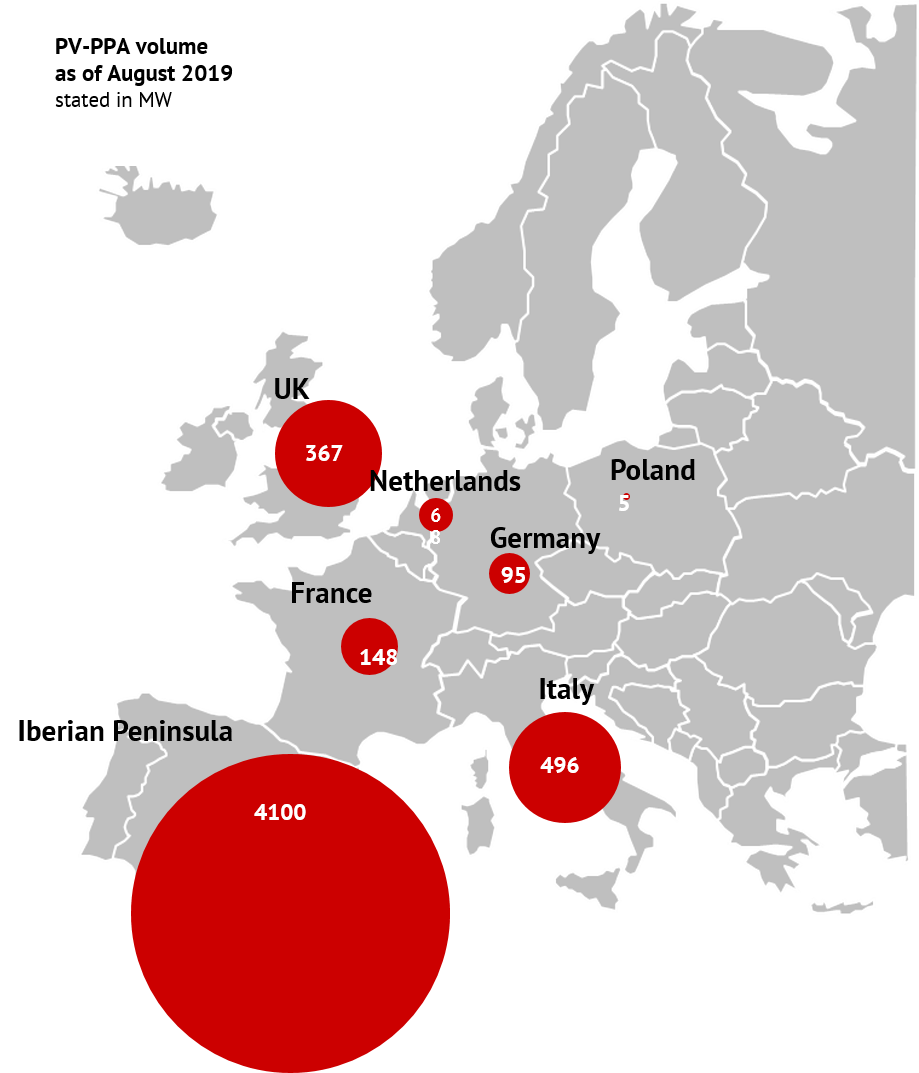
Especially on the Iberian peninsula, PV-PPAs have been increasing significantly since the beginning of 2018. Over the next few years, plant operators there will feed power from over 4000 MW of PV capacity into the grid without subsidies. In comparison, the topic of “PV-PPA” in Germany has so far been a niche existence.
In 2019, plant operators concluded the first four PV-PPAs for a total installed capacity of 95 MW.
Axpo and Max Solar, for example, want to gain experience with their 1.5 MW system. On the other hand, EnBW and Energiekontor are jointly implementing the first major 85-megawatt project in Brandenburg – financed by a 15-year PPA3.
What speaks for a long-term trend?
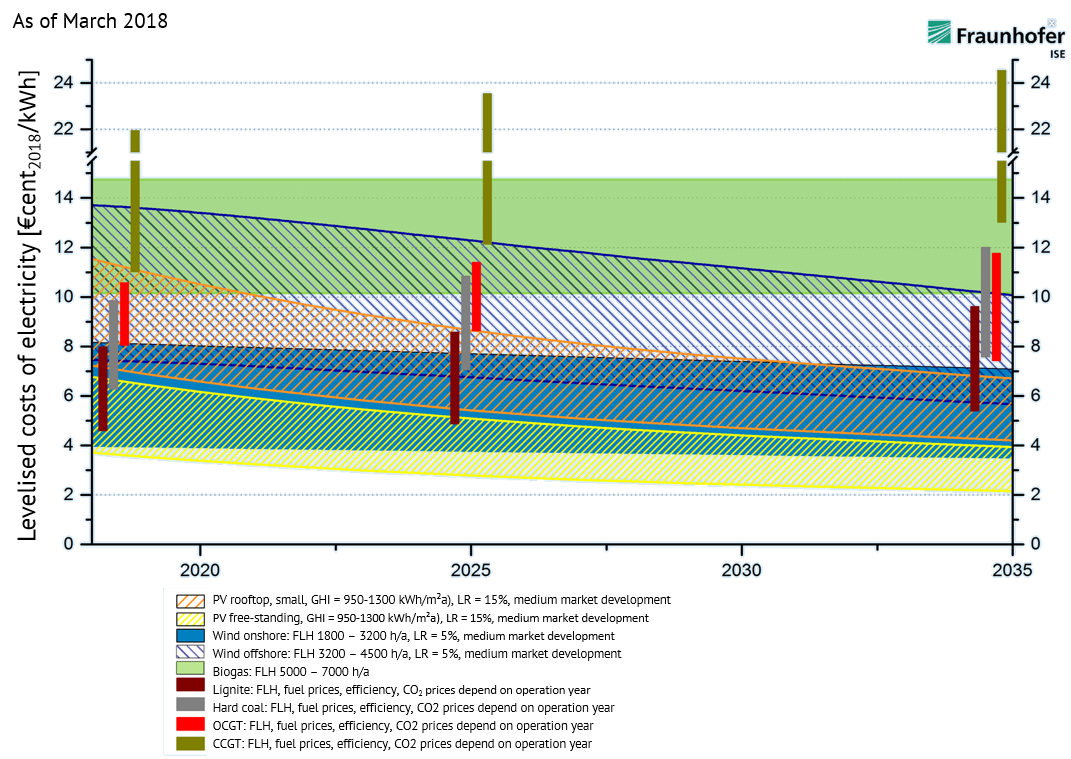
There are some indications that the subsidy-free solar expansion will continue to establish itself in Germany in the coming years. As calculations by Fraunhofer ISE (cf. Figure 2) show, PV stand-alone systems already have the lowest power production costs of all generation technologies.
They also offer potential for additional cost reductions, mainly due to the continued fall in the price of solar modules4. PV systems in Germany will increasingly be able to be operated economically without subsidies.

Figure 2: Development of power generation costs for different generation plants (Fraunhofer ISE 2018)5
Some market players seem to share this expectation: For example, Thüga Erneuerbare Energien and the CEE Group signed a declaration of intent at the end of August to install 500 MW of unsubsidised PV capacity in Germany by 2023.
In times of an increasingly intensive climate debate, discussions about the phasing out of EEG funding and weakening wind expansion, it seems only logical that the subsidy-free solar expansion will play a major role in the course of the energy turnaround in the coming years.
The question for all parties involved is: How do the parties (project developer, investor or independent power producer (IPP), consumer) determine a fair purchase price for a long-term PV-PPA?
PPA valuation: step by step to a “fair value”
The search for the “fair value” of a PV-PPA is divided into several steps. The first step is to find a measure of the actual value of the solar power under given market conditions and depending on the risk distribution. In a second step, it is again necessary to analyse how these market conditions will develop in the future.
Why forward market prices alone are not enough
In order to get an idea of the developments on the power markets, the first thing one usually does is to look at the baseload future prices on the futures markets. They provide information on fundamental price trends and are a good indicator of market expectations of future power prices. Let’s take a closer look, but there are some reasons why they do not correctly reflect the value of PV power:
- The price for a baseload delivery reflects the average price over the 24 hours of the day. This average includes both the low prices during the night and the higher prices in the event of strong demand during the day. However, a solar park feeds exclusively to these actually more valuable hours. This increases the specific sales value of the system.
- The average reflected in the baseload future prices also includes hours of negative power prices. In 2018, the hourly spot market price in Germany fell below zero 140 times. However, a rationally acting marketer would not feed the PV power into the grid during these hours, but rather regulate the system and thus further increase the specific sales value of the system.
- Finally, the “cannibalisation effect” in the merit order model must be taken into account. Solar parks are characterised by a high simultaneity of their feed-in time. When the sun shines, a large supply of PV power with marginal costs close to zero pushes into the merit order and thus lowers the price level. The more PV capacity installed, the more this effect depresses the power price in times of feed-in and thus the specific sales value for solar systems.
In order to determine a fair value for PPAs, a further value is therefore usually used in addition to the future market opinion at base prices.
How much is PV power worth? Valuation with the base parity ratio (step 1)
The base parity ratio, BPR for short, is a factor that makes the value of power from fluctuating renewable energies (here PV) comparable with the base prices on the futures markets. The exact procedure is described in detail in the Energy Brainpool Whitepaper: “PPA II: Market Analysis, Pricing and Hedging Strategies”.
In order to determine the base parity ratio, the sales revenue specific to the type of production is calculated. The three problems mentioned above are taken into account. The PV sales revenue indicates how much euros a PV system can actually earn per potentially fed-in megawatt hour on an annual average. The ratio of this sales revenue to the baseload future price ultimately yields the base parity ratio.

Base Parity Ratio
Conversely, if we multiply available future prices by the respective BPR, we obtain a value that correctly reflects the actual value of power generated by this plant type (in EUR/MWh). On this basis, we can now calculate the fair value for a PV-PPA.

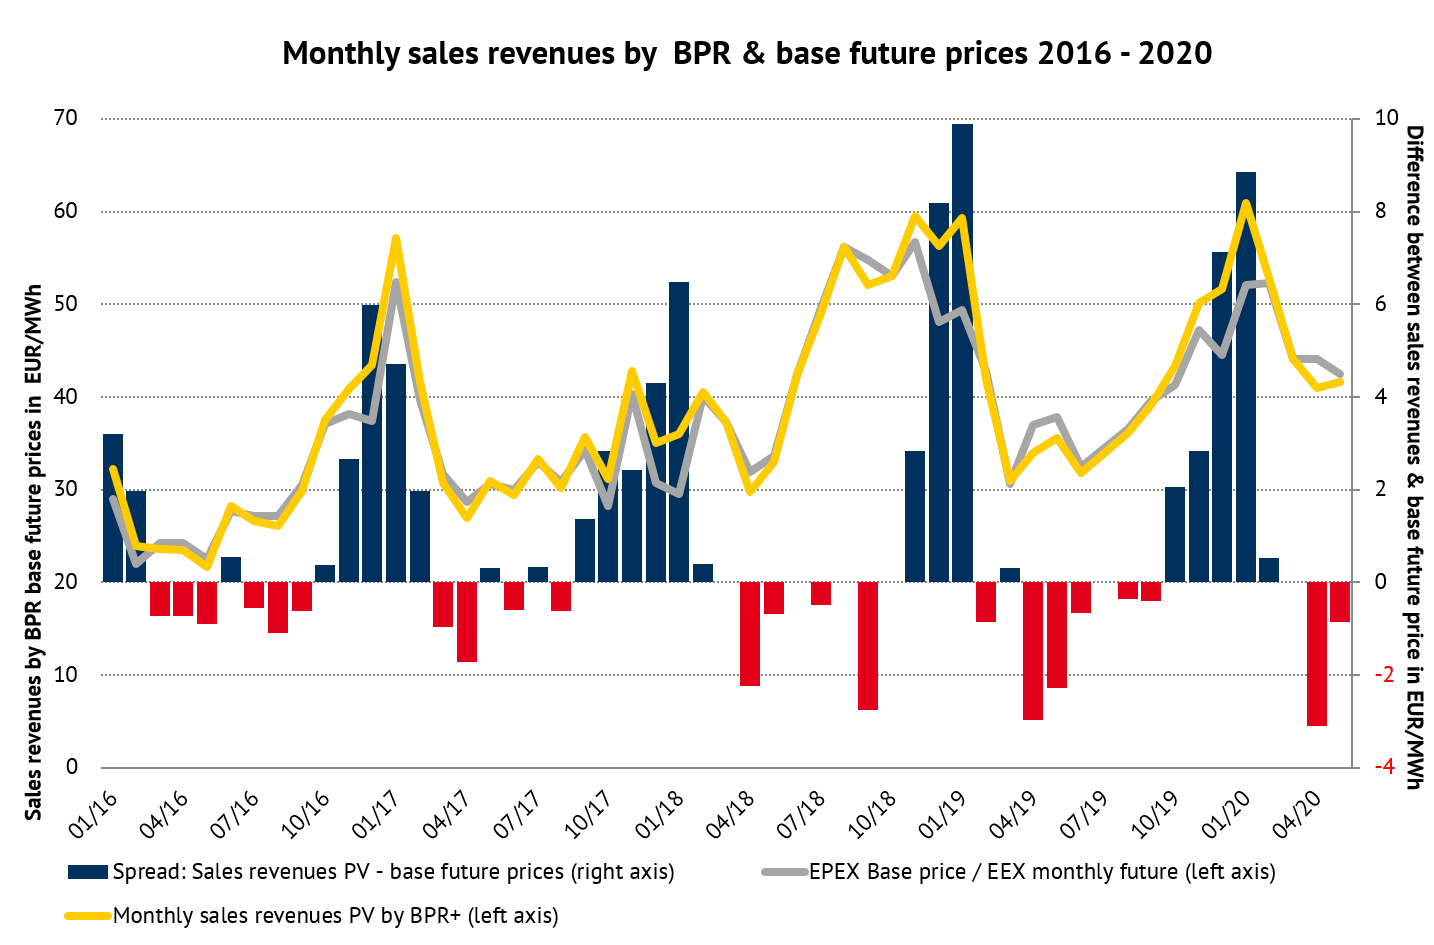
Figure 3: Development of monthly PV-PPA valuations and base future prices on futures markets 2016 – 2020 (Source: Energy Brainpool)
As can be seen in Figure 3, the sales revenue of PV systems (“PV PPA valuation”) fluctuates considerably over the year in relation to future prices. In particular, the “cannibalisation effect” can be clearly seen when comparing the summer and winter months: When there is strong sunshine in summer, a large supply of PV power regularly pushes into the merit order and lowers prices.
In winter, on the other hand, exactly the opposite is true: every potentially fed-in amount of solar power significantly exceeds the value of forward contracts. If we look at the BPR on an annual basis, it has been around 95 % in recent years. The value of power from PV systems would therefore be overestimated at one year base future.
From the value of PV power to “fair value”: risk discounts to consider (step 2)
Once the actual value of the solar power has been determined, the players have to consider possible risks in the second step. In general, these risks need to be identified and quantified as well as possible. They are then distributed fairly or priced in by the risk carrier as a corresponding discount.
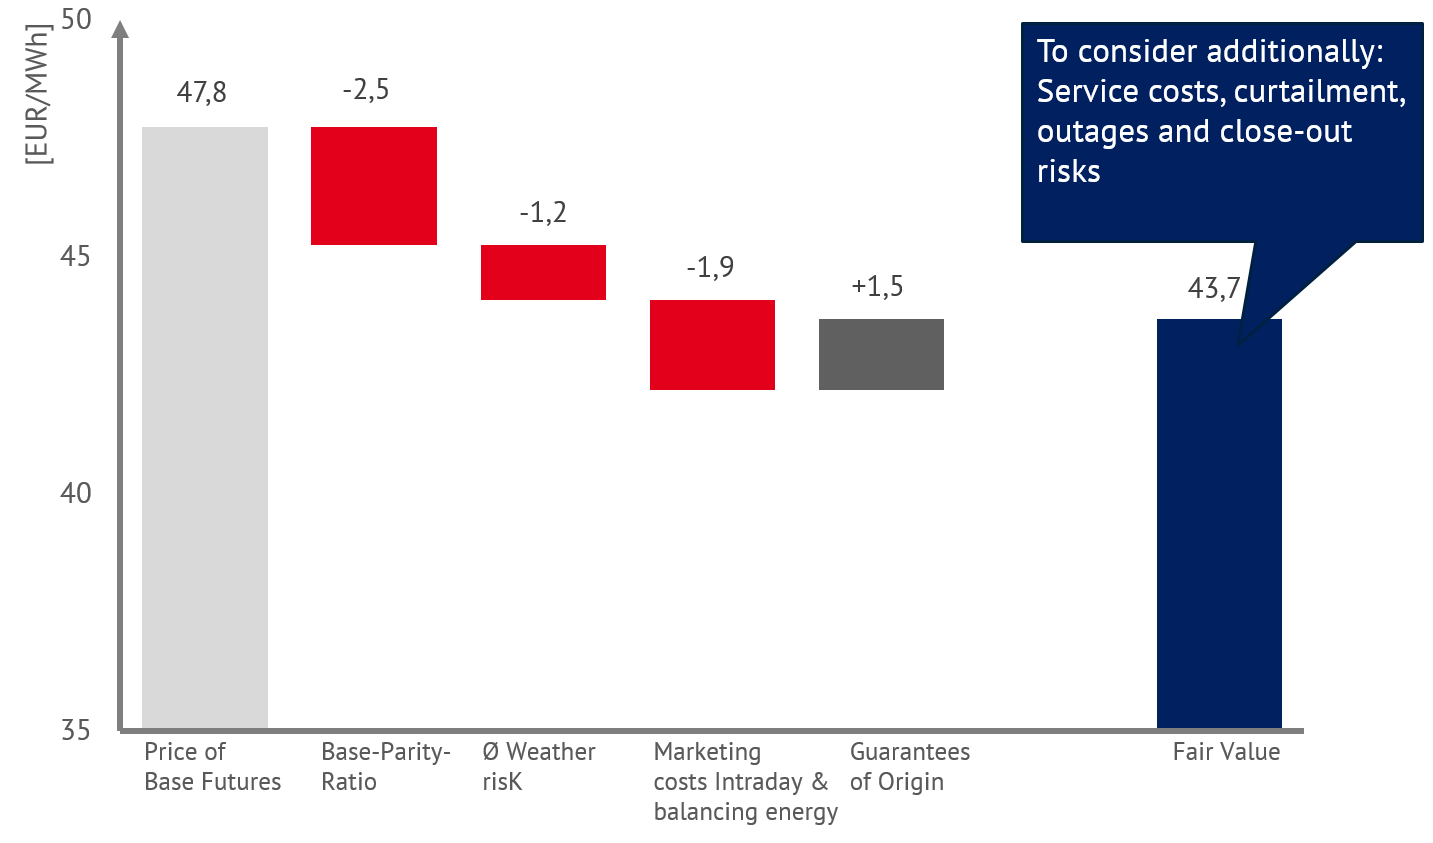
Figure 4 shows the exemplary calculation of a “fair value” for a PV system in Germany for the year 2020. Starting from the base future prices, in addition to the reduced value of the PV power (represented by the BPR), discounts for weather risk, marketing and balancing energy costs as well as guarantees of origin are also taken into account here.
When and to what extent such discounts are priced in depends to a large extent on the individual contract design. The distribution of risks among the contractual partners is determined there. An example: If the parties agree the P90 volume as the purchase volume, the risk of weather-related volume fluctuations lies with the producer. Meanwhile, in the case of as-produced PPAs, it is transferred to the buyer side.

Figure 4: Example of a fair value calculation for the year 2020 (Source: future market prices EEX, representation and calculation Energy Brainpool)
In a nutshell: What key figures do we need to determine the fair value of a PV-PPA?
It is now clear that the base parity ratio is an important indicator for adjusting the forward market prices for specific systems and determining the actual value of the PV power fed into the grid. In addition, significant risks must be quantified and, if necessary, taken into account as discounts.
For example, for a 10-year PPA with a PV system, we need estimates of the following key figures:
- Annual base prices for the next 10 years
- BPR of the next 10 years
- Quantification of risk discounts according to contract design, e.g. weather-related fluctuation margins of volumes and prices
Even if the various players can make fundamental use of the futures markets to estimate future annual base prices (futures can be traded up to six years in advance), only the next three years will be liquidly traded on the exchanges. Everything else is too dependent on future market conditions for market participants and therefore difficult to assess.
How fast will the exit from coal take place? How will CO2 prices develop? Furthermore, how will net power demand change as a result of sector coupling? And how are these effects related?
Here it becomes clear that the comparison of consistent power market scenarios helps to limit the scope for solutions and to obtain reliable estimates of the long-term development of power prices. A good example of this is the EU Energy Outlook, which limits these questions for the whole of Europe.
Further questions arise for the assessment of the future BPR or the quantification of significant risks, which remain unanswered without power market modelling: How do different PV expansion paths affect the “cannibalisation effects”? How many hours of negative power prices will there be in which PV power cannot be sold? How strongly can weather fluctuations affect the market in the first place?
Given this complexity, it is clear that modelling power price scenarios can make a key contribution to reducing uncertainties in determining fair value. These mutually fair purchase prices are ultimately necessary to ensure the solvency of the players involved and thus enable PV expansion outside the EEG on a sustainable basis.
[1] https://www.montelnews.com/News/Story.aspx?id=882536&highlightCsv=audax
[2] https://www.pv-magazine.com/2019/01/15/another-big-solar-ppa-signed-in-italy/
[3] https://www.maxsolar.de/maxsolar-nimmt-erste-pv-anlage-mit-verguetung-ueber-ppa-in-betrieb/
[6] ENTSOE-Transparency
Authors: Carlos Perez Linkenheil and Calvin Triems


