With the current “EU Energy Outlook 2060”, Energy Brainpool shows long-term trends in Europe. The European energy system will change dramatically in the coming decades. In addition to climate change and an outdated power plant fleet, current geopolitical tensions are also forcing the European Union and many countries to change their energy policies. What do these developments mean for power prices, revenue potential and risks for photovoltaics and wind?
Since the beginning of the invasion of Ukraine by Russia on 24 February 2022 at the latest, the world has been a different place on the energy markets. Even before that, the electricity markets were constantly changing. Especially due to the evolution of energy policies to reduce CO2 emissions, power price scenarios are continuously developing.
As a result, the evaluation of market developments, assets and contracts, investment decisions, power purchase agreements (PPAs) or business models are constantly changing.
The “EU Energy Outlook 2060” shows the developments in Energy Brainpools Central scenario for the EU 27, including Norway, Switzerland and the UK. In general, the actual developments in the individual countries can vary significantly. In order to be able to make well-founded decisions, detailed modelling of the individual national markets and the country-specific influencing factors, including sensitivity analyses, is essential.
Energy Brainpools Power Price Scenarios
Currently, Energy Brainpool offers three power price scenarios. Figure 1 shows the various trends for the scenarios. The differences relate to the assumptions on the development of commodity prices as well as the power plant fleet and flexible electricity demand.
The “Central” scenario
In the “Central” scenario, it is assumed that because of the current tensions with Russia, Europe will stop importing Russian pipeline gas by 2027 at the latest. From 2027 onwards, the price of natural gas in Europe is determined by the world market price for LNG. In the long run, fossil natural gas will be substituted by synthetic fuels and in particular green hydrogen.
To the extent that natural gas is still used for power generation, its price must fall to remain competitive. The scenario assumes a strongly decentralised energy system in the future with a considerable expansion of renewables, to reduce Europe’s general dependence on fossil fuels imports in the medium run, and to eliminate it as soon as possible. This process is accompanied by an increase in the flexible demand for electricity. In addition to the increasing production of hydrogen by electrolysers, heating is fully decarbonised until 2060 by further expanding the deployment of heat pumps. By 2060, the share of electric vehicles and trucks in Europe increases to 95 percent.
The “Tensions” scenario
The “Tensions“ scenario assumes that the current tensions between Russia and the west will continue and intensify in the coming years. Consequently, Europe stops the imports of Russian pipeline gas as early as possible. The price of natural gas is then based on the world market price for LNG. European consumers are competing for LNG with Asian markets. This leads to a high natural gas price level also in the medium run. A sharp increase in CO₂ prices compared to the Central scenario is anticipated, both to generate additional revenues to refinance government debt, and to promote technological development for the applications of hydrogen. In certain countries, for example in Germany, the scenario assumes a slower expansion of renewables than in the Central scenario, due to skilled labour shortages and a lack of political support.
The “Relief” scenario
The “Relief” scenario assumes that the relationship between Europe and Russia will ease off again in the coming years. Thus, imports of Russian pipeline gas will continue in the medium run. Nevertheless, there is the political will in Europe to limit the fossil fuel dependence on Russia and therefore less natural gas is imported than before the Ukraine war. Moreover, the expansion targets for renewables adopted during the crisis are kept in place.
Extension of the power price scenarios until 2060
For the current scenario update, the scenarios have been extended from the previous endpoint of 2050 to the year 2060. The development of the scenario assumptions until 2060 is based on the hypothesis that the entire energy sector in Europe will be completely decarbonised by 2060.
In the “Central” and “Relief” scenarios, European carbon neutrality is achieved by 2060, while the “Tensions” scenario represents a “falling short” scenario with a slower expansion of renewables. Not only is Carbon neutrality achieved with an increased expansion of renewables, but requires also a structural change in the main consumption sectors industry, transport and buildings. Two “megatrends” play a key role in this context.
The first megatrend consists of efficiency measures in all three sectors, so that final energy consumption will be significantly reduced by 2060. For example, the measures include:
- more efficient logistics and use of car sharing in the transportation sector,
- renovation for greater insulation in the building sector,
- and higher efficiency in the provision of process energy in the industrial sector.
The second megatrend represents the transformation from a fossil to a renewable energy supply. In order to cover the final energy consumption, applications that involve the combustion of fossil fuels are still heavily used today. These include for example:
- internal combustion engines in the transportation sector,
- gas and oil heating in the building sector,
- and the use of natural gas in the production of ammonia in the chemical industry.
These fossil fuels will be replaced over the years to 2060 by emission-neutral energy sources such as green electricity, green hydrogen, synthetic biofuels, and fossil fuels with “Carbon Capture Utilisation and Storage” (CCUS). The resulting increase in demand for the energy carriers electricity and hydrogen will be offset by the increased expansion of renewable generation plants.
The Development of commodity prices
In the short run, current developments on the futures markets are taken into account for fuel and CO2 prices. Gas prices in particular are currently still at a very high level; the decline in the coming years is therefore even more distinct (see Figure 3).
The development of medium- and long-term commodity prices for hard coal, oil and EUAs from 2030 to 2060 is based on the Announced Pledges Scenario (APS) of the IEA’s World Energy Outlook (WEO) 2022 (IEA, 2022) [1]. In 2021, this scenario was newly introduced, and replaces the “Sustainable Development Scenario” (SDS) in our power price scenarios, which was discontinued starting this year.
In contrast to the SDS, only the emission reductions to which governments have already committed in the form of “pledges” are realised in APS. Since the last update of the World Energy Outlook one year ago, the price paths for EUAs and oil have increased slightly, while coal prices have experienced a modest decline after 2040. In addition to general market influences, EUA prices are mainly driven by the policy design of the EU ETS.
For natural gas, it is expected in the medium run that the European natural gas price be aligned with the world market price for liquefied natural gas (LNG). As probably the most important import source for Europe, US LNG is assumed to set the price. The export price for U. S. LNG historically corresponds to the U. S. natural gas benchmark price (Henry Hub). In addition, there is a demand-related mark-up for transportation within the U. S. and liquefaction of natural gas for transportation as LNG.
In addition, to estimate the price of U. S. LNG in the European market, the costs for freight and regasification in Europe must be taken into account. Figure 2 shows the composition of the cost components based on the Henry Hub Price Forward Curve, as well as the median assumptions for liquefaction, freight, and regasification costs.
Considering exchange rate and inflation assumptions, the natural gas price is 22.60 EUR2021/MWh. This price is set in the scenario for the years 2030 to 2040. It corresponds almost exactly to the level assumed by the World Energy Outlook 2022 for the price of natural gas in Europe for 2030.
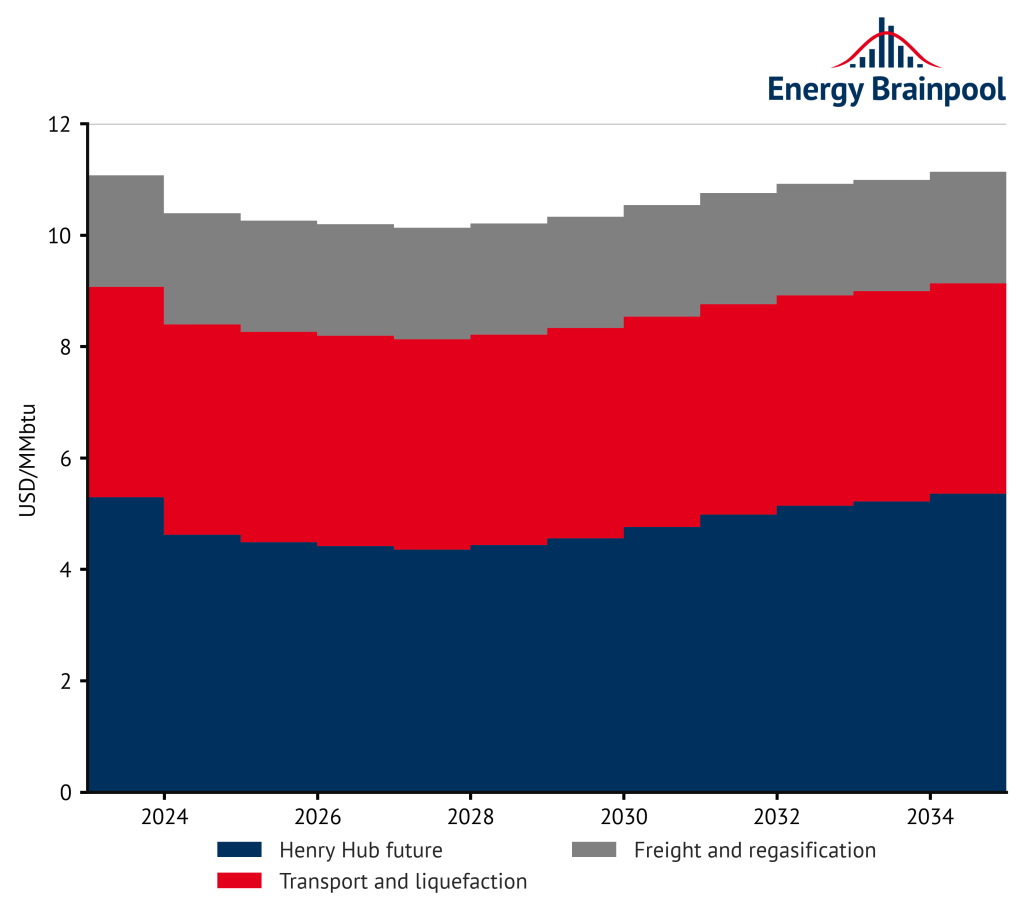
Figure 2: cost components at the global LNG market (Sources: US Office of Fossil Energy and Carbon Management, 2022; IEA World Energy Outlook 2022)
In the long-term, hydrogen will replace fossil natural gas in its end uses. It will either be imported or produced from electricity by means of electrolysis. We assume that such green hydrogen will be traded on the world market and undercut the “clean gas price” from 2040 at the latest.
The “clean gas price” consists of the price for natural gas plus the EUA price multiplied by the natural gas emission factor of 0.2 tCO2/MWhth. This increases the price pressure on natural gas after 2040, and a successive displacement of natural gas takes place.
The resulting commodity price paths are shown in Figure 3. Compared to today’s level, in this scenario the prices for gas and hard coal decrease continuously until 2030. Until 2060, the coal price then remains at a nearly constant level, while the gas price decreases steadily after 2040. The CO2 price rises to just under EUR 180/tCO2 in 2060.
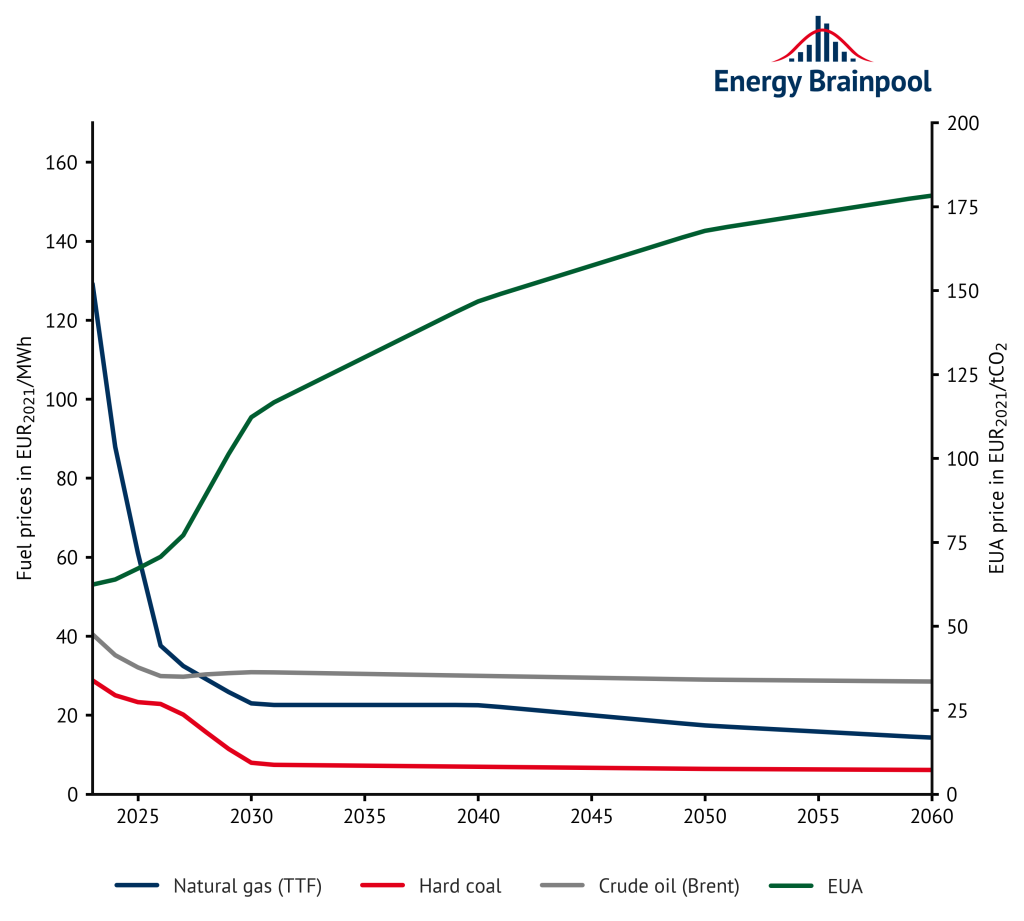
Figure 3: commodity prices (Sources: IEA World Energy Outlook 2022, „Announced Pledges Scenario“; Energy Brainpool, 2022)
What will the European power plant fleet of the future look like?
Fossil generation capacities have dominated the power plant fleet in Europe. In many cases, the power plants currently in the market have already reached an advanced age: They will have to be decommissioned or replaced by 2050. The only exceptions are power plants already under construction.
At the same time, the results of European climate policy also affect the development of the European power plant fleet. Meanwhile, almost all EU states have decided to phase out coal to limit the negative effects of high CO2 emissions. Well-known and proven technologies are available for the future: Gas-fired power plants, renewable energies and, in some markets, nuclear power plants.
Wind power and photovoltaics in particular continue to have great growth potential. These technologies are competitive today thanks to the sharp drop in costs. This is also evident in the rising number of PPA-based projects, especially for solar plants. However, due to the growing cannibalisation effect between plants, this trend is coming under increasing pressure.
In the Central scenario, the share of these “variable renewable energy sources” (vRES) increases to approximately 76 percent of total supply by 2050 (see Figure 4). Consequently, their often-simultaneous electricity generation is lowering the hourly electricity price more frequently and to a higher degree. All renewable technologies together account for 85 percent of the power plant fleet.
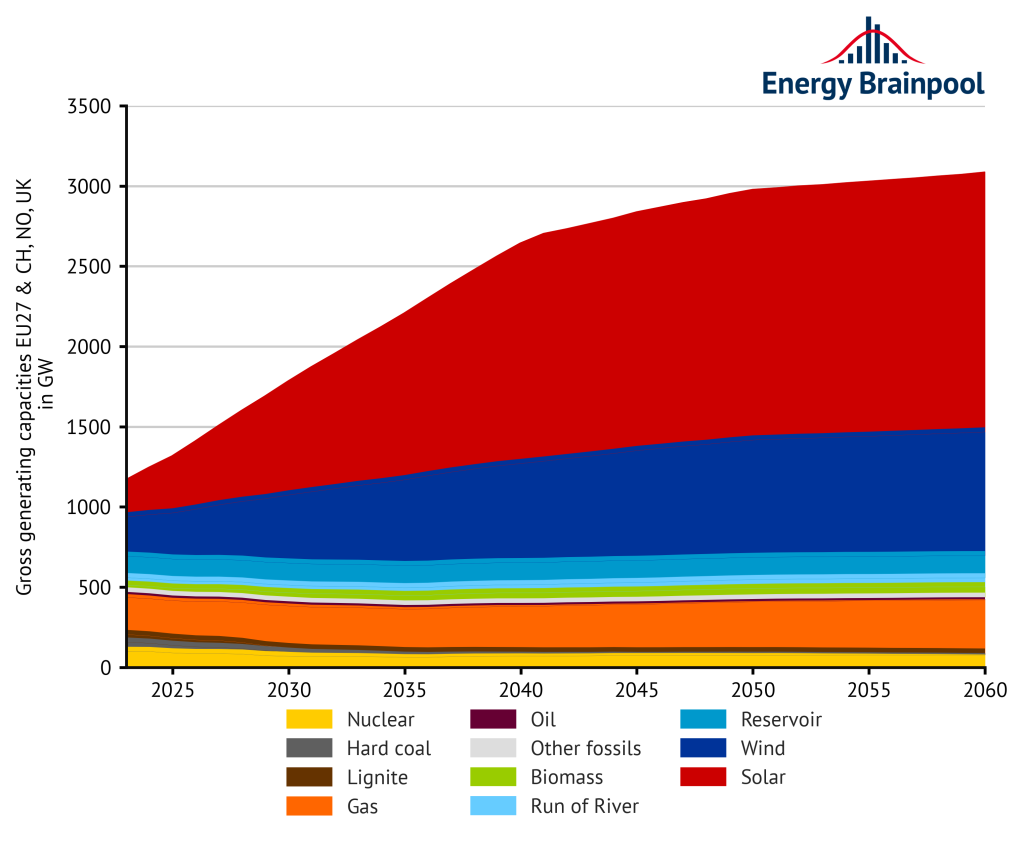
Figure 4: installed generation capacity in EU 27, plus NO, CH, and UK by energy source (Sources: Energy Brainpool, 2022; EU Reference Scenario, 2021; entso-e, 2022)
In terms of dispatchable fossil generation capacities, gas-fired power plants will be the main additions at the European level in the future. They have lower emissions than coal-fired power plants. The latter will continue to lose importance even with CCUS. However, it remains to be seen whether the planned import ban on Russian pipeline gas by 2027 at the latest and the procurement of more expensive LNG gas will lead to a lower addition of gas capacities, at least temporarily.
At the same time, modern “H2-ready” gas turbine power plants can also burn hydrogen and other synthetic fuels instead of fossil natural gas. As a result, gas turbines and combined cycle power plants will no longer be considered fossil-fuel powered generators in the long term, but will be counted among the “emission-free” power plants, at least in part.
With natural gas, the share of zero-emission generation increases to 94 percent in 2050 and 99 percent in 2060. It is therefore assumed that gas-fired power plants will remain an important technology for electricity generation in the long term.
Coal-fired power plant capacity decreases by more than 80 percent by 2050, and by more than 90 percent by 2060. Nuclear power faces a decrease in currently installed capacity of about 25 percent by 2050. Overall, the share of generation capacity of dispatchable, thermal power plants (including natural gas) is reduced from currently about 43 percent to about 15 percent by 2050. This has a significant impact on the power price structure, which is increasingly characterised by vRES.
Why does electricity demand increase until 2060?
The total electricity demand increases by approximately 65 percent by 2050 and by approximately 71 percent by 2060, as shown in Figure 5. Electricity demand increases primarily due to:
- the national hydrogen strategies and expansion of hydrogen applications (dissemination of fuel cell technology in the transport sector and increased use of hydrogen in the steel production and chemical industries),
- the growing degree of electrification of various energy services for households (especially through the spread of heat pumps and other electric heat applications for the provision of hot water and space heating),
- the rise of electric mobility.
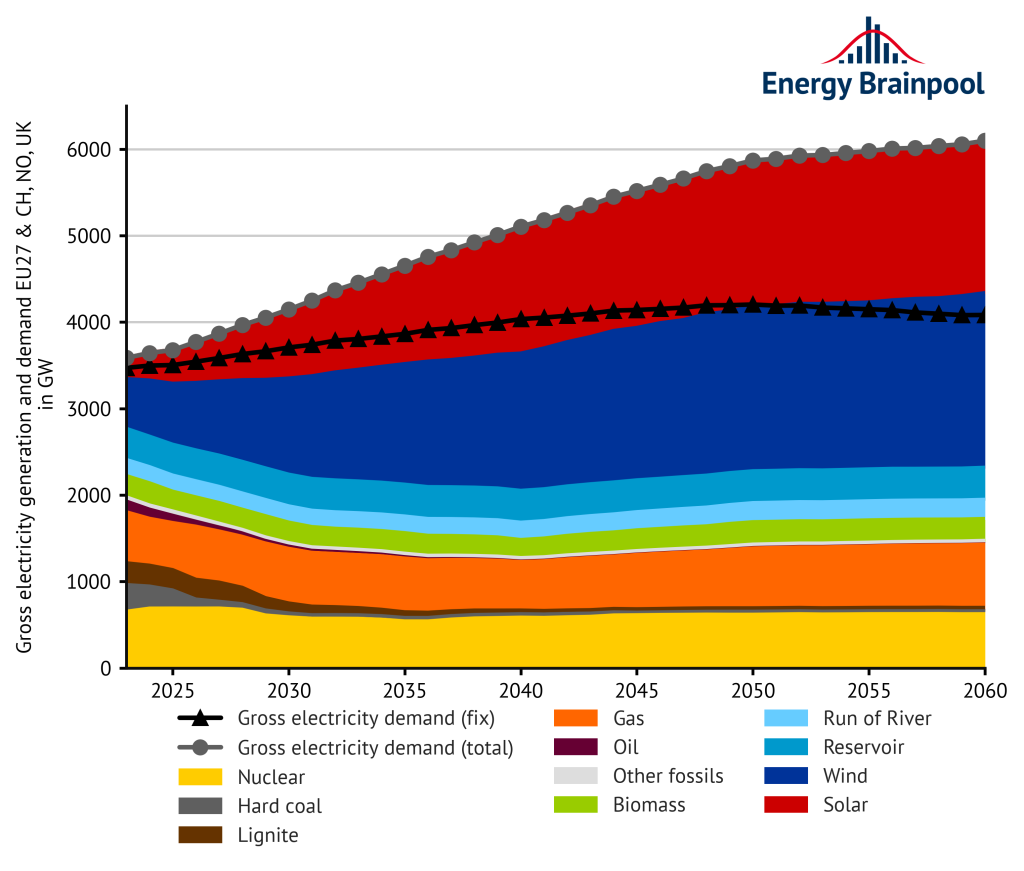
Figure 5: gross power generation and demand by energy source EU 27, plus NO, CH, and UK (Sources: Energy Brainpool, 2022; EU Reference Scenario, 2021; entso-e, 2022)
According to the European Commission’s plans, most of the economic growth will take place in the tertiary service sector, which also requires more electricity. In the industrial sector, as outlined above, higher efficiency can prevent electricity consumption from rising significantly.
The amount of electricity produced by coal-fired power plants is declining sharply. Similarly, it decreases by approximately 72 percent by 2030 and by approximately 91 percent by 2050. Meanwhile, production from gas-fired power plants increases by approximately 7 percent by 2050.
In 2050, renewable energies account for 76 percent of electricity generation. Wind plus solar power plants account for the largest share, at around 61 percent. The remaining electricity will be produced by dispatchable renewables, such as biomass power plants or reservoirs.
Another 23 percent of the electricity generated is also produced without emissions, either in nuclear power plants (11 percent) or in gas-fired power plants by burning green hydrogen (12 percent). This brings the share of emission-free generation in 2050 to just under 99 percent.
Development of average electricity prices
Which factors determine the development of the average, unweighted baseload prices between the years 2023 to 2050? Particularly relevant are commodity and CO2 prices as well as the expansion of renewable energy.
In the coming years, power prices are shaped by the currently high price level on the futures markets. From 2030 onwards, rising CO2 prices and increasing – especially flexible – electricity demand have an increasing effect on power prices. However, continuously higher feed-ins from wind and photovoltaic power plants dampen this development.
Thus, there is an increasing number of hours with low or even negative power prices. As a result, real power prices almost do not change between 2030 and 2060, but remain at a level of about 76 EUR/MWh.
Compared to the last edition of the EU Energy Outlook published in April 2022, the average power prices between 2030 and 2050 have increased slightly. While the increase in commodity prices in particular leads to higher electricity prices between 2030 and 2035, the expansion of wind and PV plants causes lower prices in many countries after 2040.
Large deviations are noticeable between different European countries. The ranges of variation in Figure 6 illustrate this. Due to the development of commodity prices, countries with a low expansion of renewable energies in particular experience a higher increase in electricity prices.
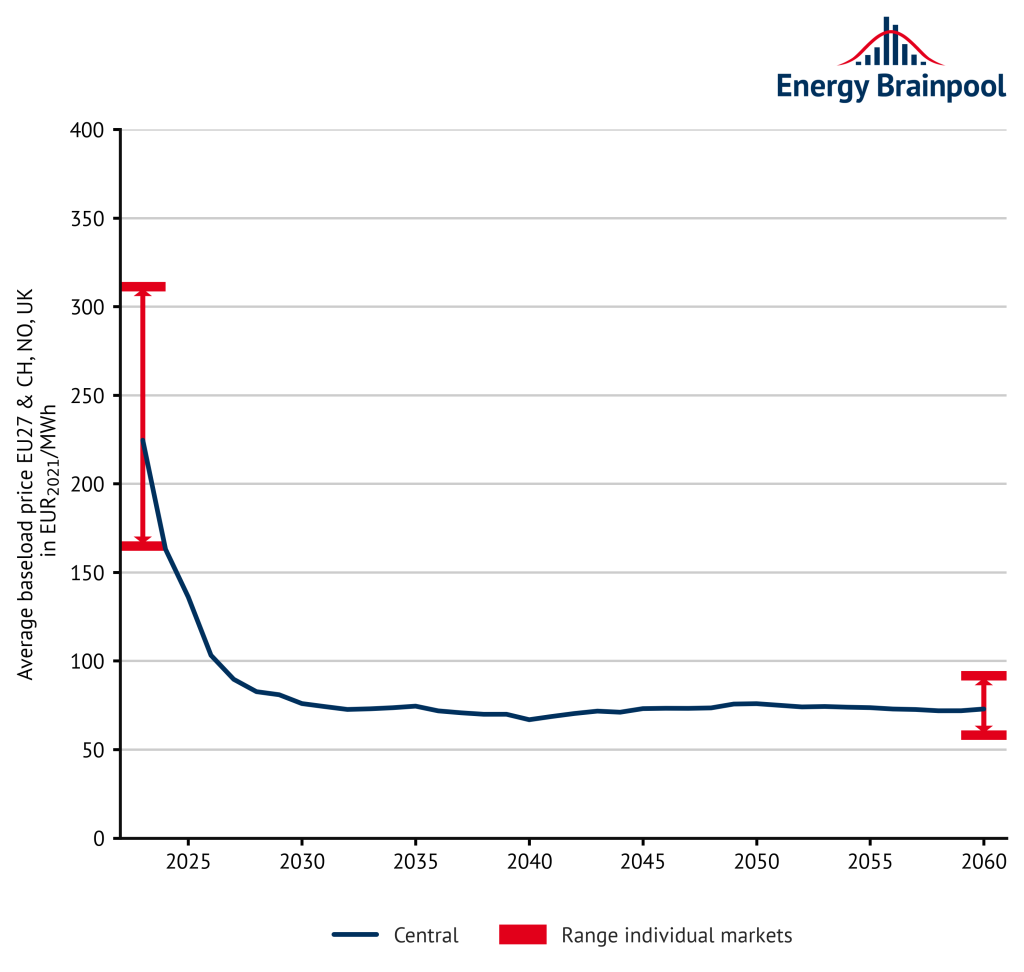
Figure 6: annual baseload prices and range of fluctuation of national individual markets for selected countries in Europe on average (Source: Energy Brainpool, 2022)
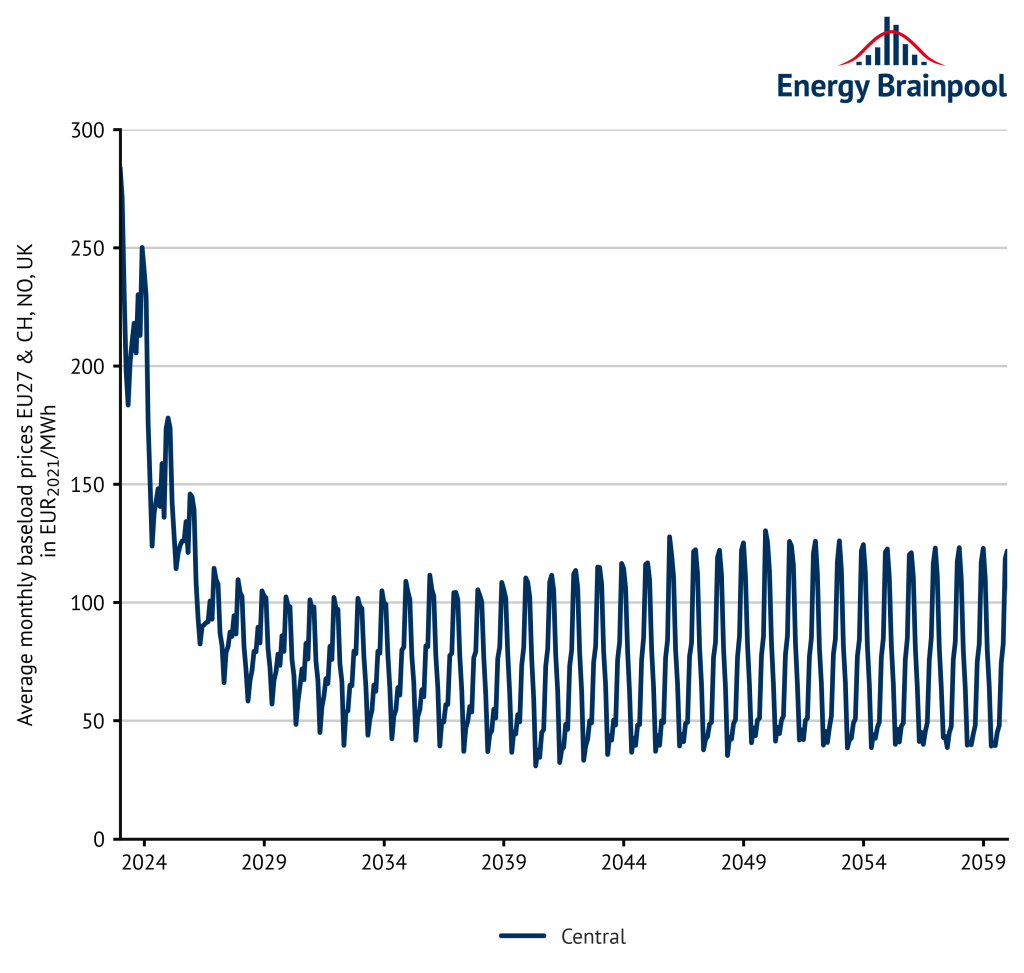
If we look at power prices on a monthly basis, the seasonality and volatility of the electricity market can be seen (see Figure 7). For winter, the analyses show rising prices due to the temperature sensitivity of electricity demand. In contrast, power prices are usually significantly lower in summer. The increasing share of solar power generation reinforces this effect by.
Below, figure 8 shows the corresponding development of average power prices in the respective scenarios.
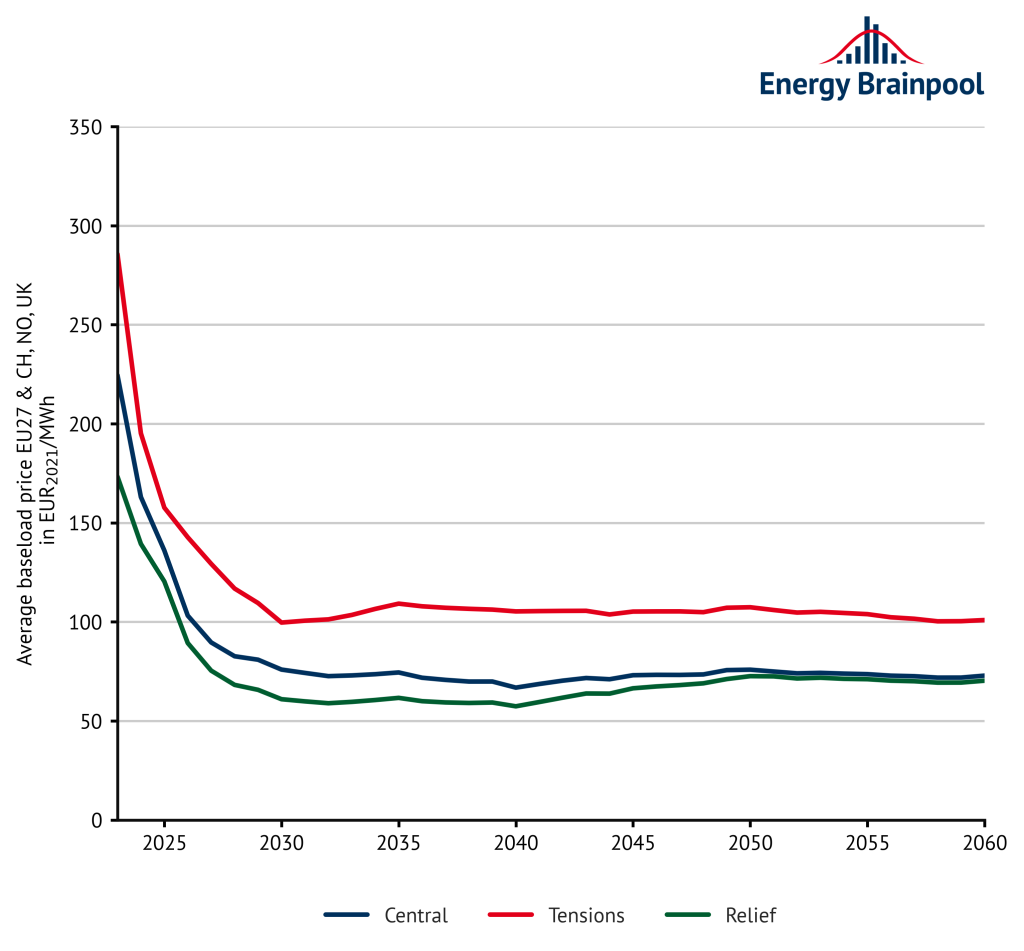
Figure 8: development of power prices in the respective scenarios in EUR2021/MWh (Source: Energy Brainpool, 2022)
What revenues can wind power plants achieve?
The sales value is the average volume-weighted power price that wind and PV plants can achieve on the spot market over the course of the year. Only generation hours with positive power prices are taken into account in the calculation (including 0 EUR/MWh).
By contrast, the sales volume indicates the share of the electricity quantities generated in these hours in the total generation quantity. The product of the sales value and the sales volume is the capture price. In contrast to the sales value, the capture price is the average annual revenue on the electricity market for the entire generation quantity. And this also applies in hours with negative electricity prices.
As Figure 9 shows, both the market value and the capture price for wind turbines remain almost constant from 2030 onwards. They only increase slightly at the end of the period under consideration. This is due to the expansion of installed capacities.
The parallel generation by a higher number of turbines reduces the power prices in these hours (cannibalisation effect). The sales volumes almost do not decrease at all on average in the EU, but in some countries, such as Germany, they decrease very significantly.
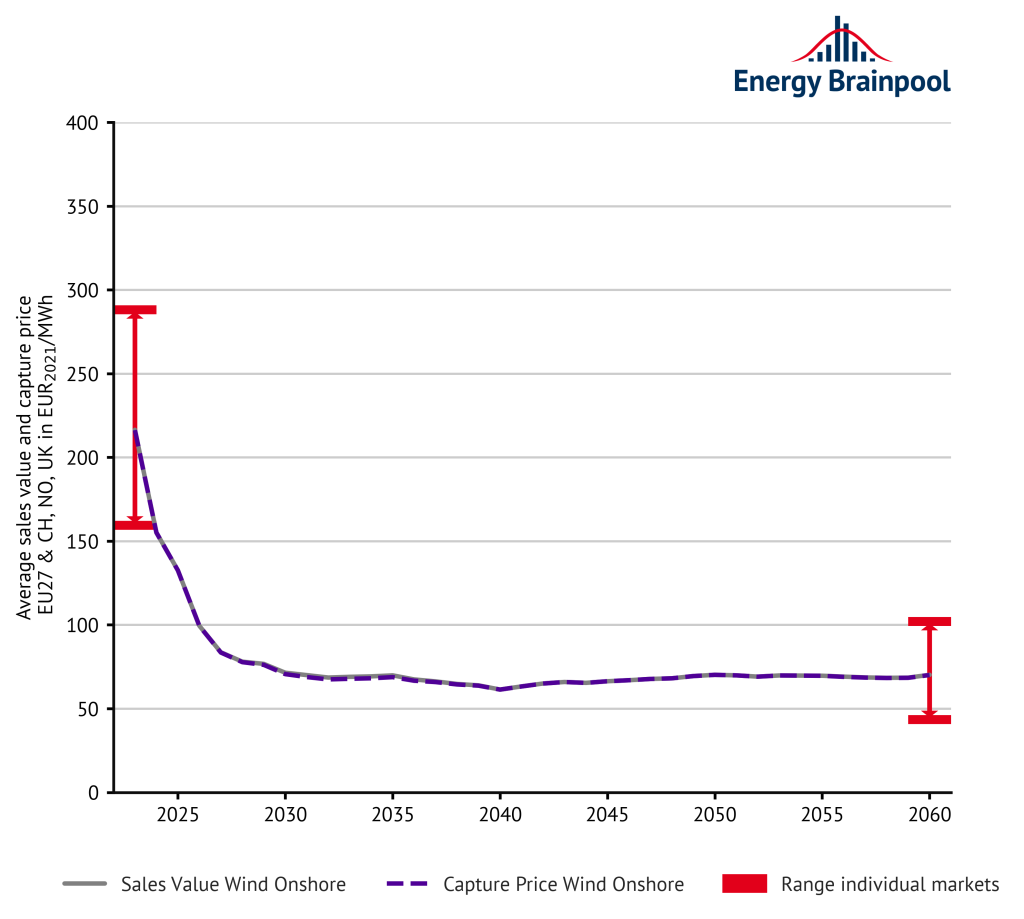
Figure 9: sales values and volumes for wind in selected EU countries on average (Source: Energy Brainpool, 2022)
The many hours, in which, despite the high share of renewable energies, dispatchable fossil power plants set the price, enable positive revenue streams. The range of the capture prices shows how different the country-specific average revenue opportunities of wind power plants are.
In the white paper “Assessment of electricity market revenues of fluctuating renewable energy plants“, Energy Brainpool defines, among other things, the indices sales value and sales volume. These indices enable the realistic assessment of the revenue potential of fluctuating renewable energies on the electricity market.
What revenues can photovoltaic (solar) systems achieve?
The development of the average sales value and capture price of photovoltaic systems falls more sharply than wind after 2035 (see Figure 10). The reason for this is the significant expansion of PV capacities, especially in Germany, in conjunction with the strongly pronounced simultaneity effect for PV. This is because the majority of electricity is produced during the daytime hours in summer. In hours when a lot of solar power is generated, power prices fall and so do the revenues.
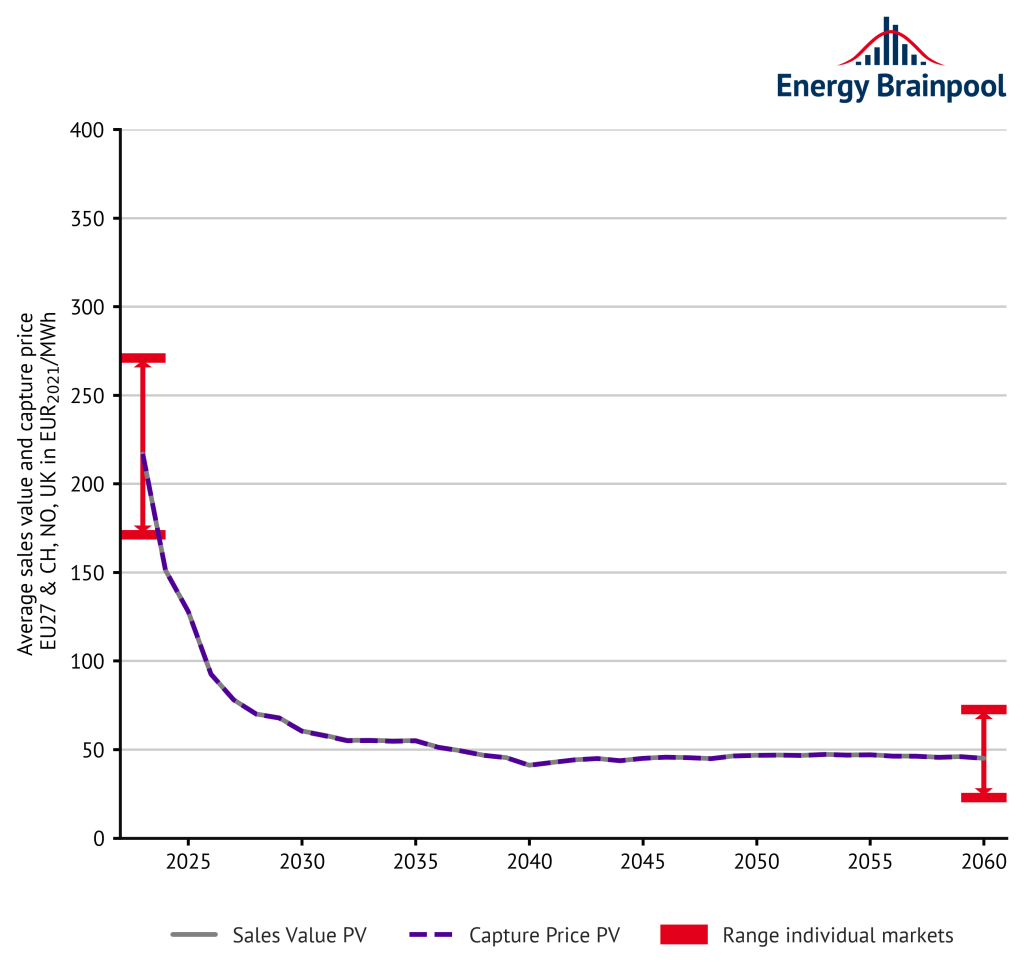
Figure 10: sales values and volumes for solar in selected EU countries on average (Source: Energy Brainpool, 2022)
For PV, too, the sales volumes remain almost constant on average in the EU. In some countries, however, there are significant decreases at times. The wide fluctuation in solar sales values across the countries shows just how much the revenue opportunities vary. However, in a sunny country, high revenues are possible even with low sales volumes. The reason for this is that plants are better utilised.
Increase in price volatility in detail
In the “Central” scenario, many factors lead to a significant increase in price volatility. Figure 11 shows the price volatility with a series of boxplots. Specifically, the boxplots describe the annual baseload prices and the hourly price quantiles for each year.
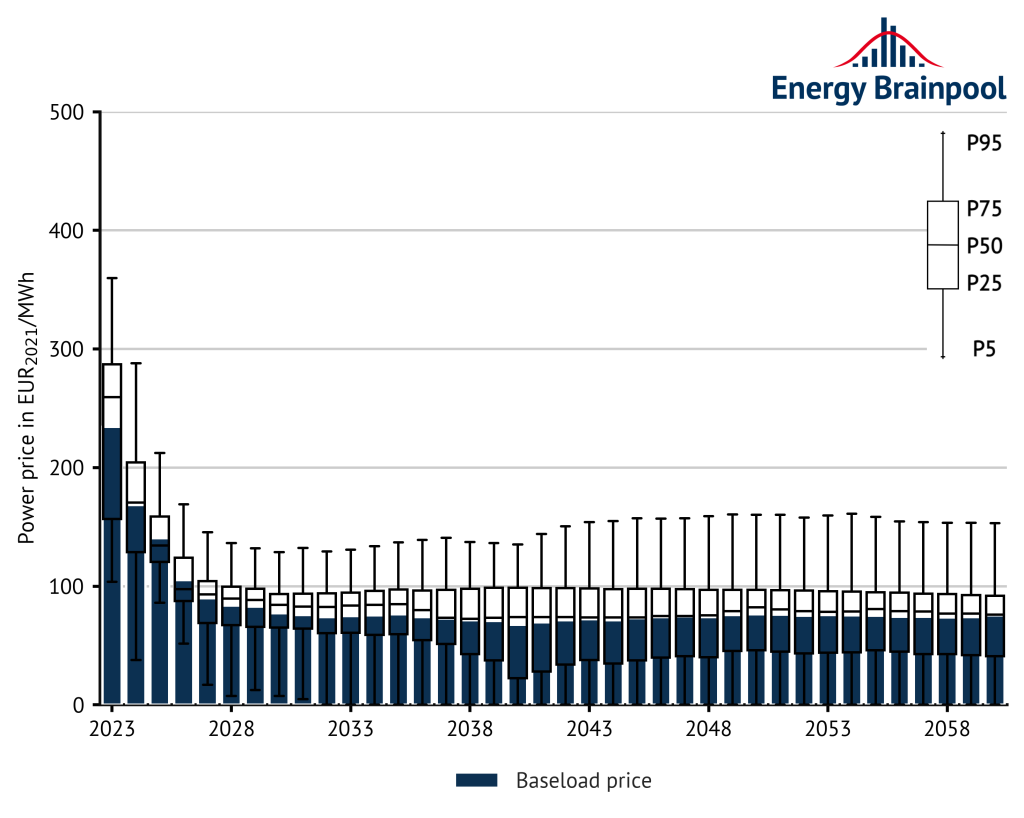
Figure 11: development of demand-weighted baseload prices and quantiles of hourly prices of selected EU countries (Source: Energy Brainpool, 2021)
On the one hand, the generation costs of dispatchable, fossil-fuel power plants are increasing due to rising natural gas and CO2 prices. On the other hand, the expansion of fluctuating, renewable energies has a price-reducing effect. As a result, extreme prices occur more frequently and become a normal part of the power price structure of the day-ahead market.
Outlook: GoHydrogen Scenario
The European Green Deal sets an ambitious goal for the EU to become the first carbon-neutral continent by 2050. In the course of the scenario update in Q4 2022, the experts of Energy Brainpool developed a new scenario “GoHydrogen” in compliance with this goal. It outlines a possible development path for the European energy supply to realise the vision with the use of hydrogen technologies.
For this purpose, a sectoral consumption analysis was conducted to determine the potential of employing green hydrogen in the industrial, transportation and building sectors. Figure 12 shows the most important subsectors of the main energy sectors that have been examined in detail in the consumption analysis.
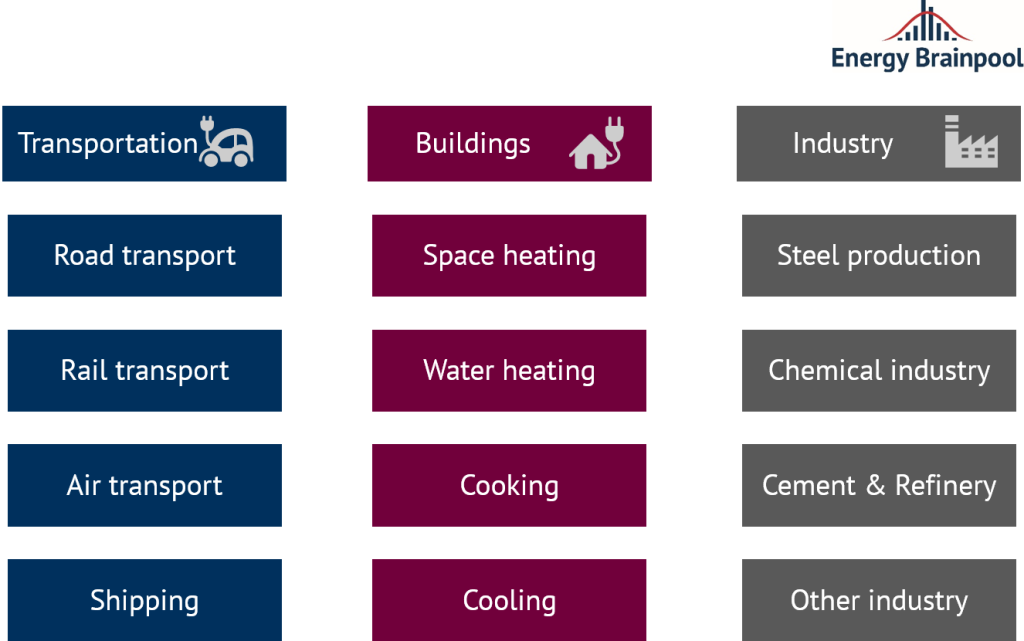
Figure 12: the main sectors and their subsectors in a sectoral consumption analysis (Source: Energy Brainpool, 2022)
The consumption analysis identified in particular the future use of green hydrogen for the following applications:
- Transportation sector:
- Dissemination of fuel cell technologies in areas of passenger and freight transport
- Building sector:
- Substitution of natural gas by hydrogen in providing hot water and space heating
- Industrial sector:
- In steel production, the hydrogen-based direct reduction process substitutes the blast furnace process
- Substitution of oil and natural gas by hydrogen / methanol in the chemical industry
The resulting hydrogen consumption is covered primarily by hydrogen production using electrolysers. In detail, the electrolysers are powered exclusively by electricity generated by renewable and/or zero-emission generation plants throughout Europe in 2050 and the subsequent years. Figure 13 shows a detailed modelling approach for the coupling of electricity and hydrogen in the “GoHydrogen” scenario.
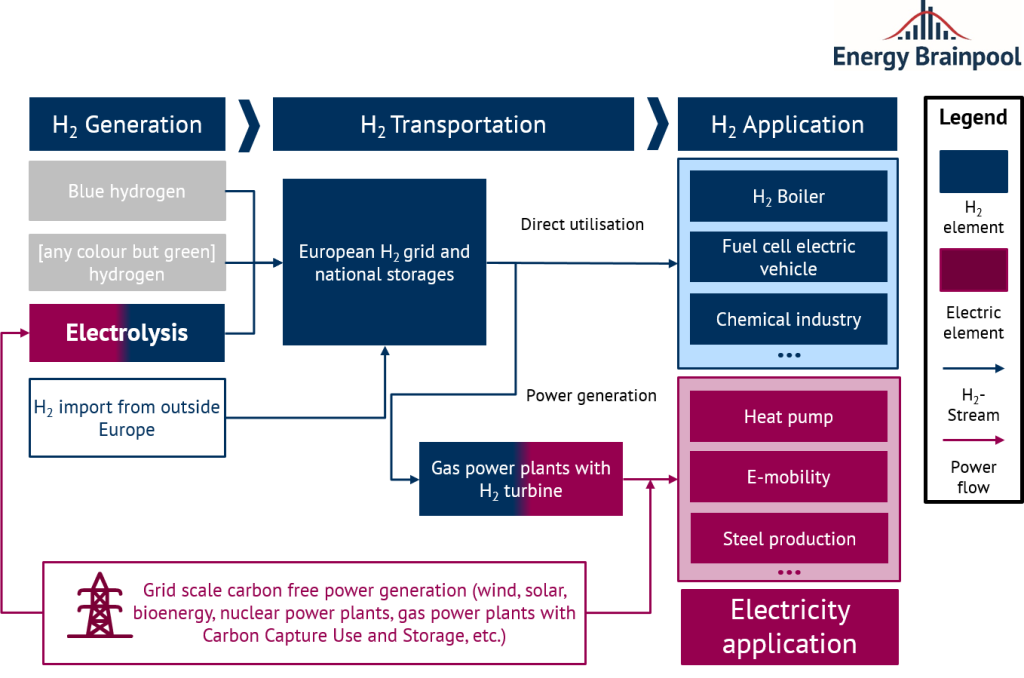
Figure 13: detailed modelling of sector coupling of electricity and hydrogen in the GoHydrogen scenario (Source: Energy Brainpool, 2022)
Last but not least
Are you interested in the results of our latest EU Energy Outlook from April 2022? You can find them here: Update: EU Energy Outlook 2050 – How will Europe develop over the next 30 years?
All information about our electricity price scenarios for the EU 27, UK, Switzerland and Norway can be found here under Energy BrainReports.
Authors
Dr. Alex Schmitt & Huangluolun Zhou
Sources
[1] EU, 2021: EU reference scenario 2020: Energy, transport and GHG emissions – trends to 2050 [online] https://op.europa.eu/en/publication-detail/-/publication/96c2ca82-e85e-11eb-93a8-01aa75ed71a1/language-en/format-PDF/source-219903975 [last accessed 16/11/2022].
[2] IEA, 2022: World Energy Outlook [online] https://www.iea.org/reports/world-energy-outlook-2022 [last accessed 16/11/2022].
[3] entso-e, 2022 [online] https://tyndp.entsoe.eu/ [last accessed 16/11/2022].
[4] US Office of Fossil Energy and Carbon Management, 2022 [online] https://www.energy.gov/fecm/listings/lng-reports [last accessed 16/11/2022].
Footnotes
[1] The World Energy Outlook only contains price assumptions up to 2050, which are extrapolated in our scenarios between 2050 and 2060 at half the slope of the previous ten years.



15. February 2023
Hello Dr Alex,
Thanks for the very interesting analysis on project prices in your article
EU Energy Outlook 2060 – how will the European electricity market develop over the next 37 years?
I have a quick question on the baseload price projections and appreciate if you could help to explain.
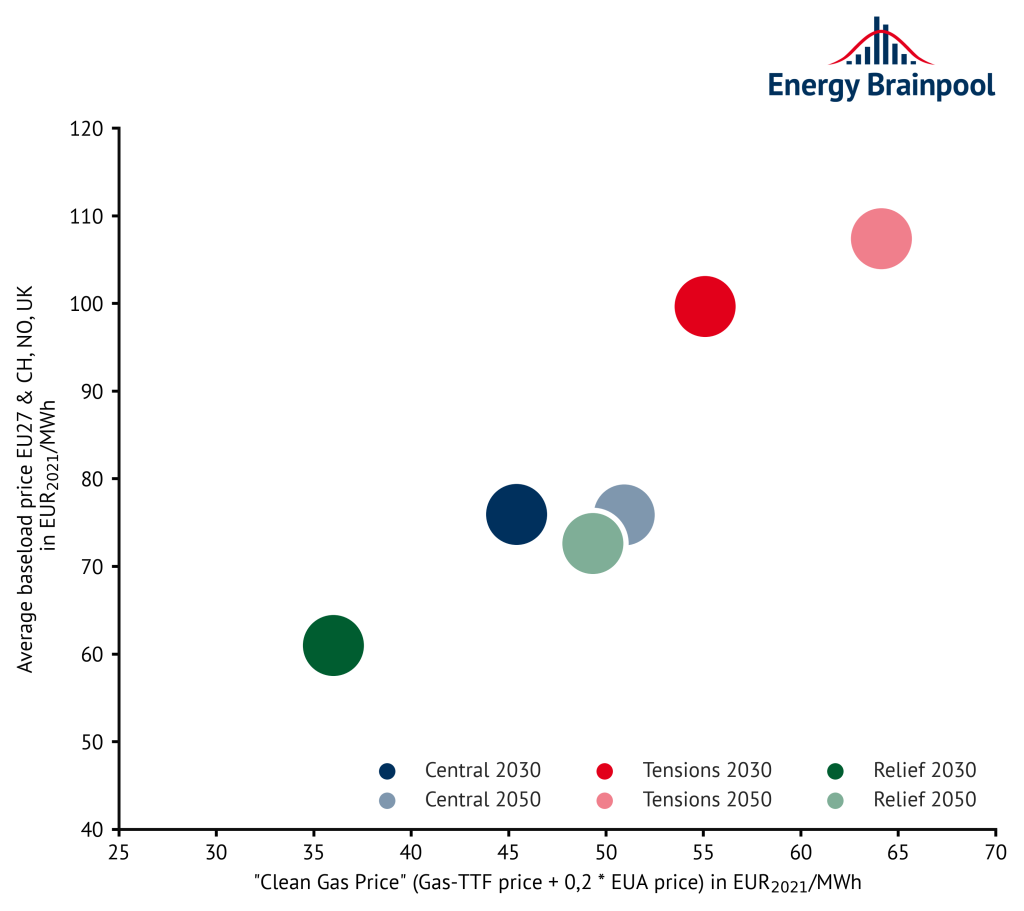
What is the reason for the continuous increase in price from 2030-2050 for both Central and Relief scenario? In the April version of your report the Tension scenario seems to share the same trend but it stays almost constant in the November version.
Thank you very much!
17. February 2023
Dear PuiWah,
Thank you for your question! There are a number of factors causing the increase of power prices over time. On the supply side, we assume rising CO2 prices in the future, which leads to higher (marginal) cost of generating electricity from fossil fuels, and hence to higher power prices in some hours through the merit order. On the demand side, we have conducted a detailed country-by-country analysis in the latest update, and updated our assumptions in particular for the “flexible” power demand (e.g. electrolyzers or e-mobility). As a consequence, demand increases over time in most countries, which also has a positive impact on power prices. As for the difference between Central and Tensions, while European baseload prices stay constant over time in Tensions, they are at a considerably higher level. In other words, the price difference between Central and Tensions is large in the 2030s, and decreases over time. This is caused by a slower and/or delayed expansion of wind and solar power in many countries in Tensions. Put differently, in Tensions, the different factors affecting the power price show a tendency of “canceling each other out”, thus leading to little changes over time.
Kind regards
The team of Energy Brainpool
1. March 2023
Dear Energy Brainpool,
Thank you very much for the detail explanation!
Will look out for your future reports.
2. March 2023
Dear Puiwah,
Thank you for your appreciation and interest in our blog.
Kind regards
The team of Energy Brainpool