The European energy system will change dramatically in the coming decades. In addition to climate change and an outdated power plant fleet, current geopolitical tensions are also forcing the European Union and many countries to change their energy policies. What do these developments mean for prices, revenue potential and risks for photovoltaics and wind?
With the current “EU Energy Outlook 2050”, Energy Brainpool shows long-term trends in Europe. Since the beginning of the invasion of Ukraine by Russia on 24 February 2022 at the latest, the world has also been a different place on the energy markets. Even before that, the electricity markets were constantly changing. Especially due to the evolution of energy policy plans to reduce CO2 emissions, power price scenarios are continuously developing. As a result, the evaluation of market developments, assets and contracts, investment decisions, power purchase agreements (PPAs) or business models are also constantly changing.
But at present, it is not enough just to continue developing conclusive power price scenarios. Nothing is as it was before – since 24 February 2022. The current geopolitical crisis is too disruptive for that. That is why we at Energy Brainpool calculate and analyse in a new scenario world.
In general, the actual developments in the individual countries can vary significantly. In order to be able to make informed decisions, detailed modelling of the individual national markets and the country-specific influencing factors, including sensitivity analyses, is essential.
The new “Central” scenario
In the previous EU Energy Outlooks, the “Energy Brainpool” scenario served as the basis for assessing the future development of power prices, capture prices and other variables. In the course of the Ukraine crisis and its consequences for the energy markets, we replaced this with the new “Central” scenario. From this basic scenario, we have derived the variations “Tensions” and “Relief”.
The “Central” scenario takes into account the current tensions between the European countries and Russia. Explicitly, the main assumption of the scenario is that Europe will stop importing Russian pipeline gas from 2027 at the latest. We also assume that in the medium to long term the overall (import) dependence on fossil fuels will be reduced.
Big role of the current geopolitical situation
In the shortrun, current developments on the futures markets are taken into account for fuel and CO2 prices. These are affected by the current geopolitical situation. Figure 1 shows the share of Russian imports in all imported quantities of the energy sources natural gas, hard coal and crude oil, as well as the share of all imported quantities in total consumption in the EU 27 states.
This results in a direct dependence on Russian energy sources in final consumption of 28.1% for hard coal, 25% for crude oil and 37% for natural gas. These values result, for example, for hard coal from an import share in final consumption of 48 % multiplied by the Russian import share of 54 %.
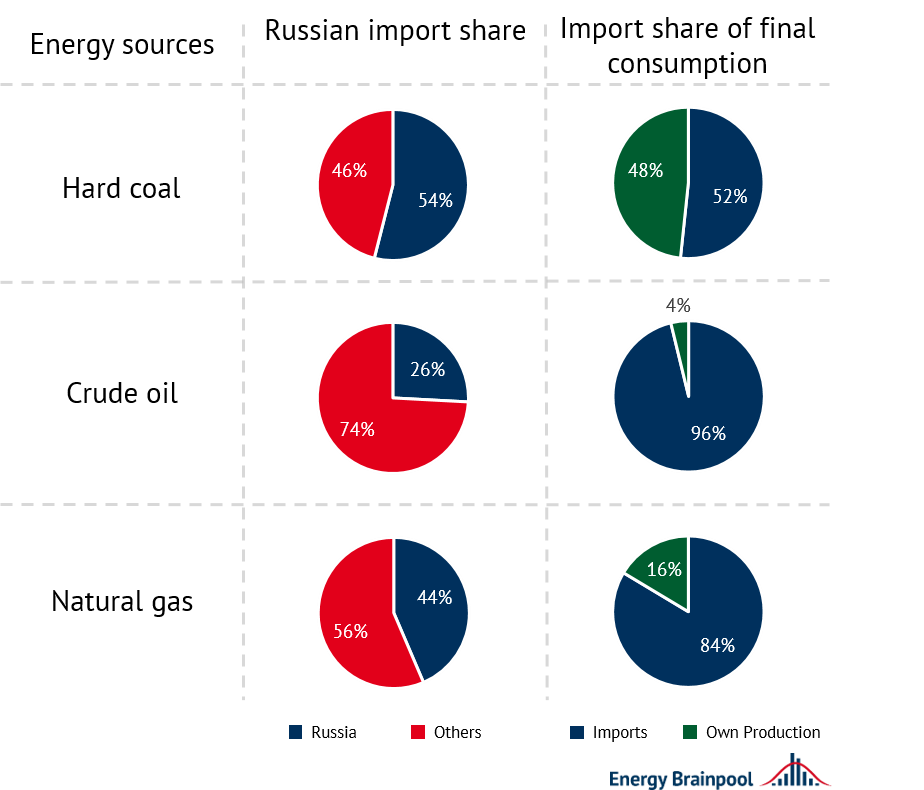
Figure 1: EU 27 dependence on Russian energy sources (Source: Eurostat)
In general, the substitution of Russian energy sources, which is envisaged by almost all EU states as quickly as possible, has two effects: In the short to medium term, prices rise and volatility on the futures markets increases. This is especially true for natural gas, as procurement from alternative sources is most clearly dependent on the existing infrastructure (LNG terminals, pipelines). In the “Central” scenario, natural gas prices for the next few years are therefore assumed to correspond to the average price level on the futures markets since mid-February 2022.
LNG decisive for European natural gas price from 2027 onwards
From 2027 onwards, the European natural gas price will be based on the world market price for LNG. As the most important import source for Europe, US LNG can be assumed to set the price. Historically, the export price for US LNG corresponds to the American natural gas benchmark price (Henry Hub). In addition, there is a demand-related surcharge for transport within the USA and the liquefaction of natural gas for transport as LNG.
In order to estimate the price of US LNG on the European market, costs for freight and regasification in Europe must also be considered. Figure 2 shows the composition of the cost components based on the Henry Hub Price Forward Curve, as well as the mean assumptions for liquefaction, freight and regasification costs. Taking exchange rate and inflation assumptions into account, a natural gas price of 22 EUR2020/MWh results. This price is assumed in the scenario for the years 2027 to 2040.
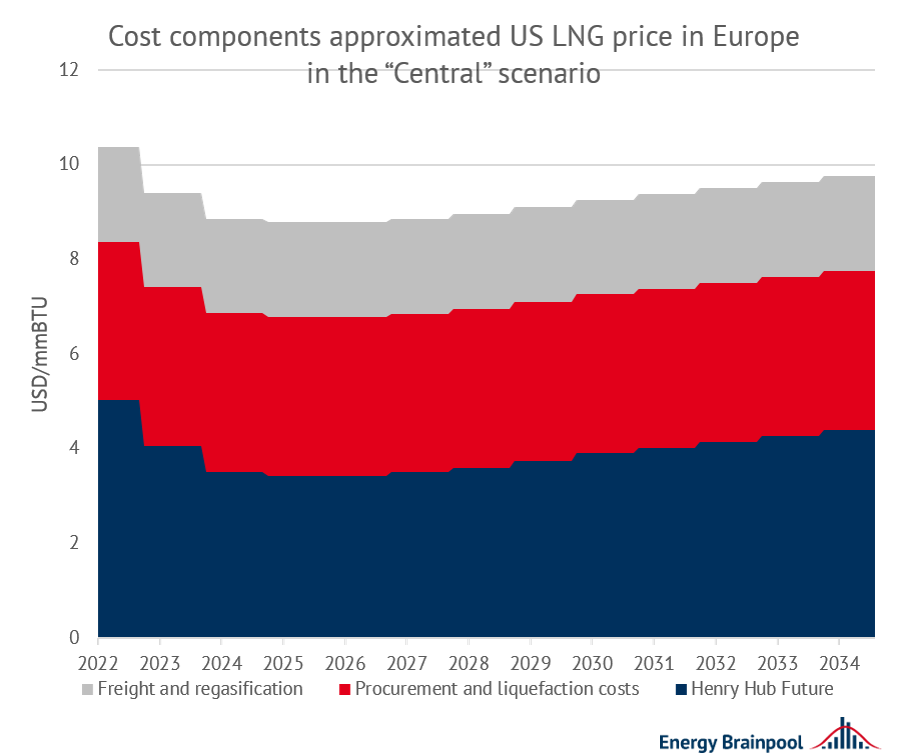
Figure 2: cost components on the world LNG market (Sources: US Office of Fossil Energy and Carbon Management; IEA World Energy Outlook)
Hydrogen replaces natural gas in the long term
In the long term, hydrogen will replace fossil natural gas in its end uses. Specifically, this will either be produced from electricity by means of electrolysis or imported. We assume that such “green” hydrogen will be traded on the world market and undercut the “clean gas price” from 2040 at the latest. Basically, the “Clean gas price” consists of the price for natural gas plus the EUA price multiplied by the natural gas emission factor of 0.2 tCO2/MWhth. This increases the price pressure on natural gas after 2040. A successive displacement of natural gas takes place.
Similar to natural gas, prices for hard coal, oil and EUAs are assumed to correspond to the average price level on the futures markets since mid-February 2022. The future market prices for hard coal and crude oil are also strongly influenced by the risk of an embargo on Russian energy imports until the end of 2023.
2040 is an important year in terms of prices
Due to stronger world market linkages and lower infrastructure hurdles for substitution, prices stabilise from 2024 onwards. By 2040, they converge to the values assumed in the current World Energy Outlook of the International Energy Agency (IEA, 2021) in the “Stated Policies” (for hard coal) and “Sustainable Development”[1] (for oil) scenarios. However, unlike natural gas, the current price shock on these commodity markets is only of a temporary nature.
In addition to general market influences, the policy design of the EU ETS mainly determines EUA prices Here, too, it is assumed in the “Central” scenario that prices converge to the corresponding value from the “Sustainable Development” scenario by 2040.
This results in the commodity price paths shown in Figure 3. Compared to today’s level, in this scenario the prices for oil and hard coal decrease continuously until 2040. The CO2 price stagnates at a level of 74 EUR2020/tCO2 until 2030, and then increases to almost 165 EUR/tCO2 in 2050.
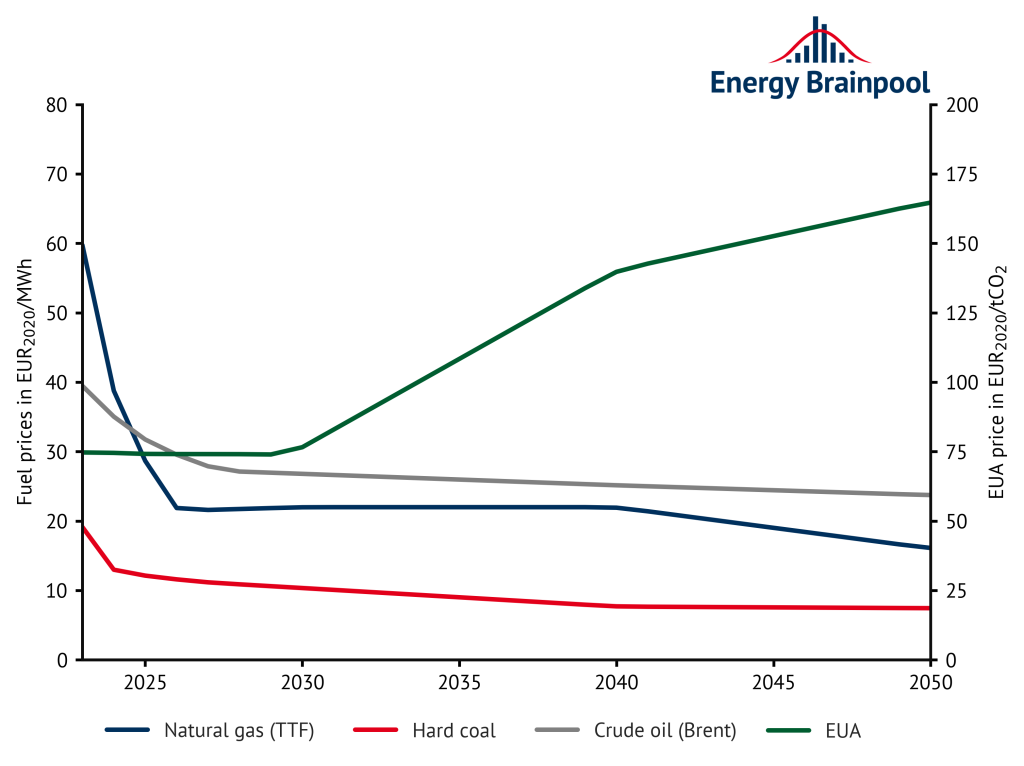
Figure 3: commodity prices (Source: World Energy Outlook 2021 (“Sustainable development”) and Energy Brainpool’s own calculations, 2022).
The role of PV and wind energy
In line with the medium-term goal of drastically reducing imports of fossil fuels and ending import dependency as quickly as possible, the scenario assumes a highly decentralised energy system in the future. This entails a significant expansion of renewable energies. Among other things, this is achieved, by homeowners across Europe building more PV systems on single-family homes and semi-detached houses, including storage. For Germany, the expansion paths correspond to the targets in the amendment to the Renewable Energy Sources Act (“EEG-Referentenentwurf”).
Figure 4 illustrates the expansion targets for PV and wind from the draft “EEG-Referentenentwurf” and especially the expansion compared to the “EBP” scenario from the last EU Energy Outlook. For PV in particular, capacity more than doubles to 400 GW by 2045.
Ongoing decarbonisation
For onshore and offshore wind, too, the plans include a significant increase to 160 GW and 70 GW, respectively, in 2045. This expansion of renewables goes hand in hand with an increasing demand for flexible power generation. In addition to the increasing production of hydrogen by electrolysers, the heating sector will be fully decarbonised by 2045 through a further expansion of heat pumps. In the transport sector, both 95 % of cars and motorbikes will be electrified by 2050.
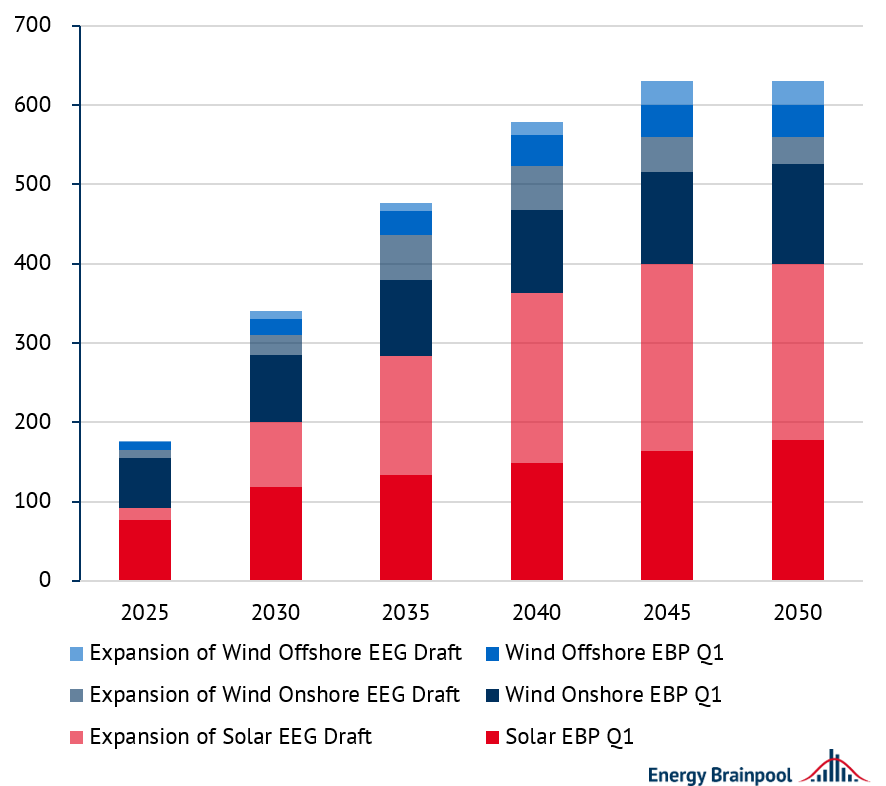
Figure 4: expansion of renewable energies by 2050 in Germany, comparison of previous scenario assumptions (EBP Q1) and assumptions from the draft EEG (Source: Energy Brainpool, 2022)
We have also partially adjusted the renewable capacities for the other EU states in the Central scenario. The aggregated European capacities per generation technology are shown in the following section.
What will the European power plant fleet of the future look like?
Fossil generation capacities have dominated the power plant fleet in Europe (cf. Figure 5). In many cases, the power plants on the market have already reached an advanced age and will have to be decommissioned or replaced by 2050. The only exceptions are power plants already under construction.
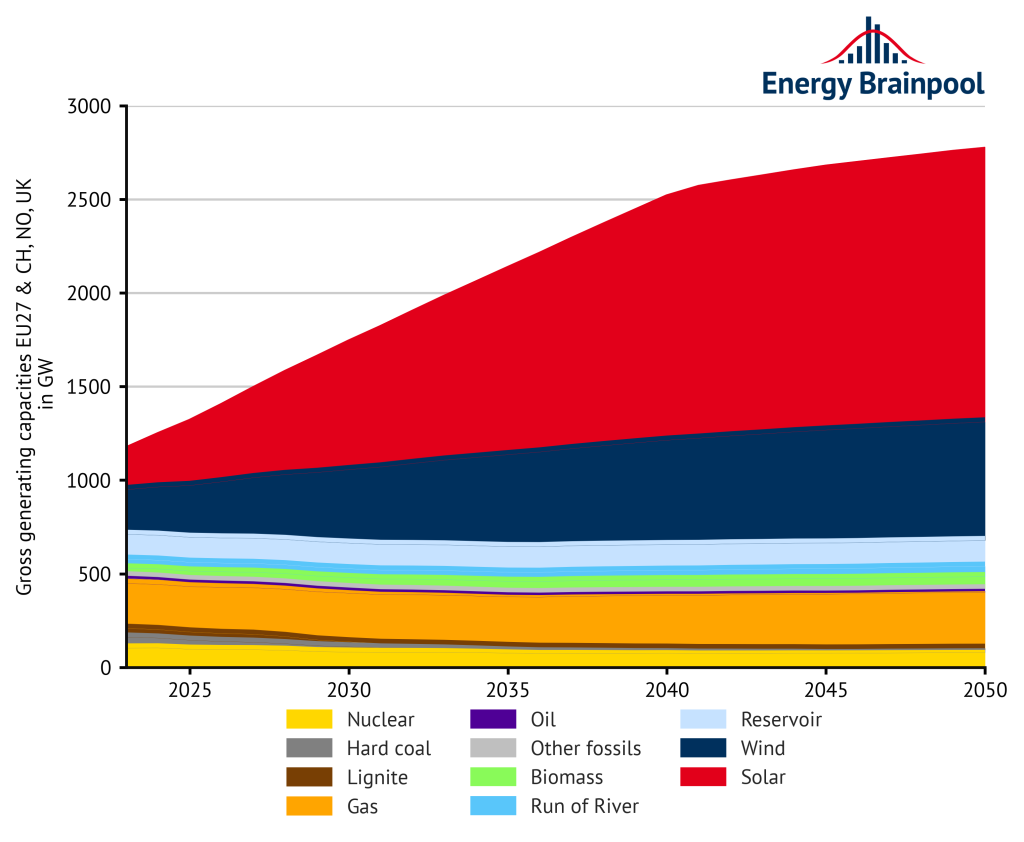
Figure 5: installed generation capacities in EU-27 (plus NO, CH and UK) by energy source (Source: Energy Brainpool, 2021; EU Reference Scenario, 2016; entso-e, 2021)
At the same time, the results of European climate policy also affect the development of the European power plant fleet. So far, eleven EU states have decided to phase out coal. In this way, they want to limit the negative effects of high CO2 emissions. Well-known and proven technologies are available for the future: Gas-fired power plants, renewable energies and, in some markets, nuclear power plants.
High potentials: wind and solar
Wind power and photovoltaics in particular continue to have great growth potential. These technologies are competitive today thanks to the sharp drop in costs. This is also evident in the increasing number of PPA-based projects, especially for solar plants. However, due to the growing cannibalisation effect between plants, this trend is coming under increasing pressure.
According to the EU Energy Outlook 2050, the share of these fluctuating renewable energieswill increase to around 75 percent of the total supply by 2050. In addition, their often-simultaneous power generation is lowering the hourly power price more and more often and largely.
All renewable technologies together have a share of 84 percent of the power plant fleet. What is interesting here is the allocation of gas-fired power plants, which, as long as they consume natural gas, are considered “fossil” power generators. By switching to green hydrogen, however, they count as “emission-free” power plants.
Gas-fired power plants play a major role
In terms of dispatchable fossil generation capacities, gas-fired power plants will be the main additions at the European level in the future. They have lower emissions than coal-fired power plants. The latter continue to lose importance even with carbon capture storage (CCS). However, it remains to be seen whether the planned import stop for Russian pipeline gas by 2027 at the latest and the purchase of more expensive LNG gas will lead to a lower addition of gas capacities, at least temporarily.
At the same time, hydrogen and other synthetic fuels can be burned in modern, “H2-ready” gas turbine power plants instead of fossil natural gas. Therefore, we assume that gas turbines and combined cycle power plants will remain an important technology in electricity generation in the long term. Thus, they are considered at least in part as emission-free generation.
The role of nuclear and coal-fired power plants
The capacities of nuclear and coal-fired power plants will be reduced by more than 51 percent by 2050. Germany, France, the UK, Spain, the Netherlands, Finland, Italy, Ireland, Portugal, Denmark and Hungary have announced coal phase-outs for the future. As a result, the currently installed capacity of hard coal in particular is set to fall sharply by around 78 percent by 2050.
Overall, the share of generation capacity of dispatchable thermal power plants will be reduced from currently about 46 percent to about 16 percent by 2050. This has a considerable influence on the structure of electricity prices, which are increasingly characterised by fluctuating renewable energies.
Why does electricity demand increase until 2050?
Above all, electricity demand increases:
- through the national hydrogen strategies,
- the increased electrification of various energy services in households
- and the rise of electromobility.
Electricity demand increases by approximately 31 % by 2050, as shown in Figure 6.
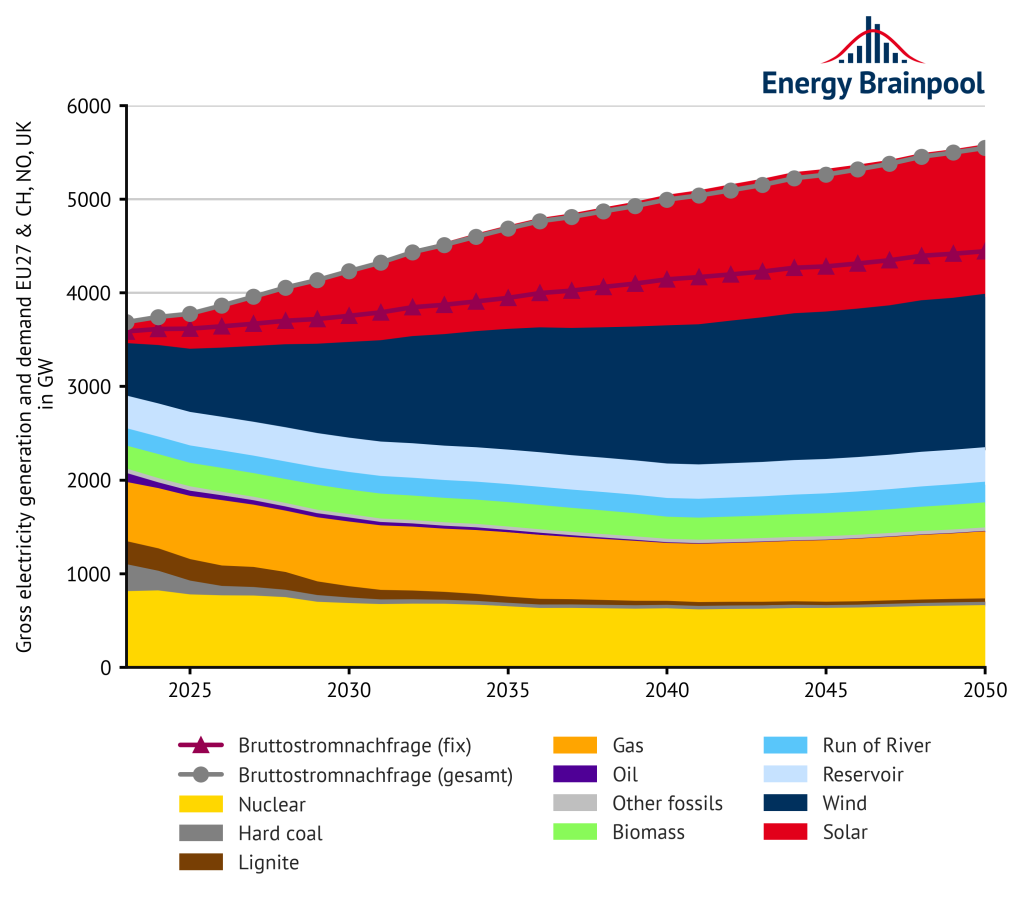
Figure 6: gross electricity generation and demand by energy source EU-27, plus NO, CH and UK (Source: Energy Brainpool, 2022; EU Reference Scenario, 2016; entso-e, 2021).
According to the European Commission’s plans, most of the economic growth will take place in the tertiary services sector, which will also require more electricity. In the industrial sector, higher efficiency can prevent electricity consumption from rising significantly. The amount of electricity produced by coal-fired power plants is declining sharply. It also decreases by around 68 percent by 2030 and by around 91 percent by 2050. Production from gas-fired power plants, however, increases by about 39 percent by 2050.
The share of renewable energies in electricity generation is 74 percent in 2050. Wind and solar power plants together account for the largest share of about 45 per cent. The remaining electricity is produced by dispatchable renewable energies, such as biomass power plants or reservoirs.
Another 25 percent of the electricity generated is also produced without emissions, either in nuclear power plants (12 percent) or in gas-fired power plants by burning green hydrogen (13 percent). This brings the share of emission-free generation in 2050 to almost 99 percent.
Development of average power prices
What factors influence how the average, unweighted baseload prices of the years 2023 to 2050 will develop? Particularly relevant are commodity and CO2 prices as well as the expansion of renewable energy. In the coming years, power prices will be shaped by the current high price level on the futures markets. From 2030 onwards, rising CO2 prices will have a price-increasing effect on power prices.
However, categorically higher feed-ins from wind and photovoltaic power plants will dampen this development. These can only be partially compensated by an increasingly flexible demand for electricity. Thus, there are increasingly hours with low and, more frequently, negative power prices. As a result, real electricity prices rise only slightly from 69 EUR/MWh to 78 EUR/MWh between 2030 and 2050.
Differences between EUR Energy Outlook November 2021 and April 2022
Compared to the last edition of the EU Energy Outlook from November 2021, the average of electricity prices between 2030 and 2050 has remained almost the same. While the significant increase in gas prices in particular leads to higher power prices between 2030 and 2038, the expansion of wind and PV plants, especially in Germany, causes lower prices after 2040.
Large deviations are visible between the individual European countries. This is shown by the ranges of variation in Figure 7. Due to the development of commodity prices, countries with a low expansion of renewable energies in particular experience a stronger increase in power prices.
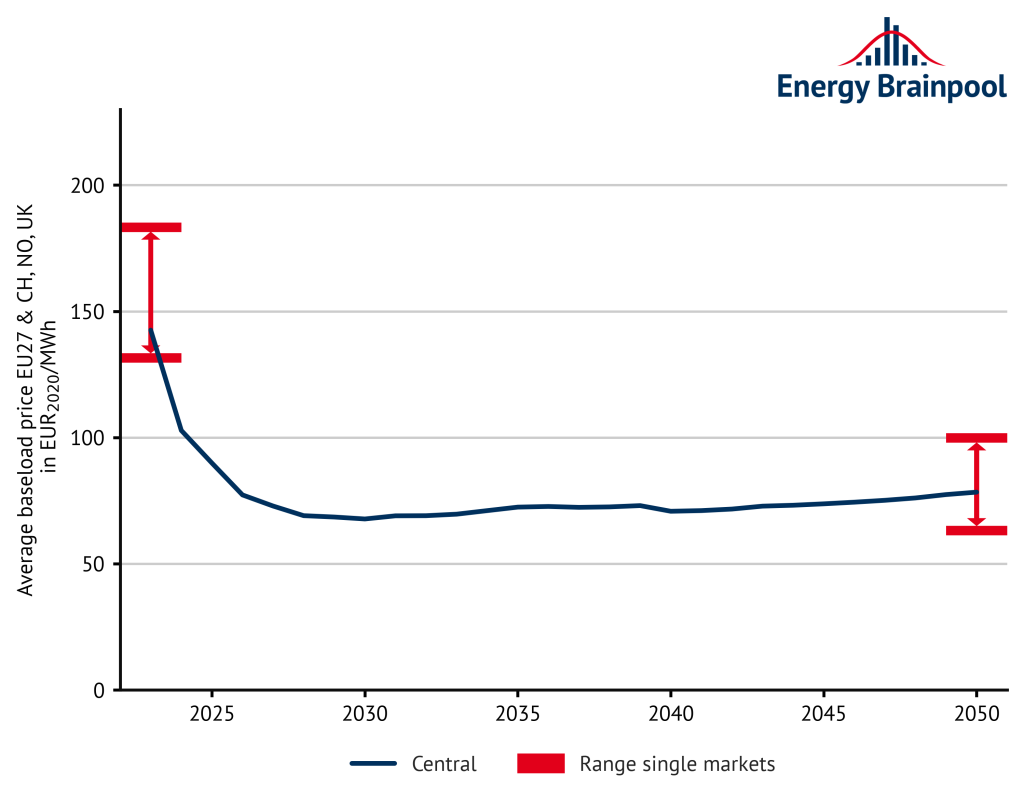
Figure 7: annual baseload prices and range of fluctuation of national individual markets on average (Source: Energy Brainpool, 2022)
If we look at power prices on a monthly basis, the seasonality and volatility of the electricity market can be seen (see Figure 8). For winter, the analyses show rising prices due to the temperature sensitivity of electricity demand. In contrast, electricity prices are usually significantly lower in summer. All in all, this effect is reinforced by the increasing share of solar power generation.
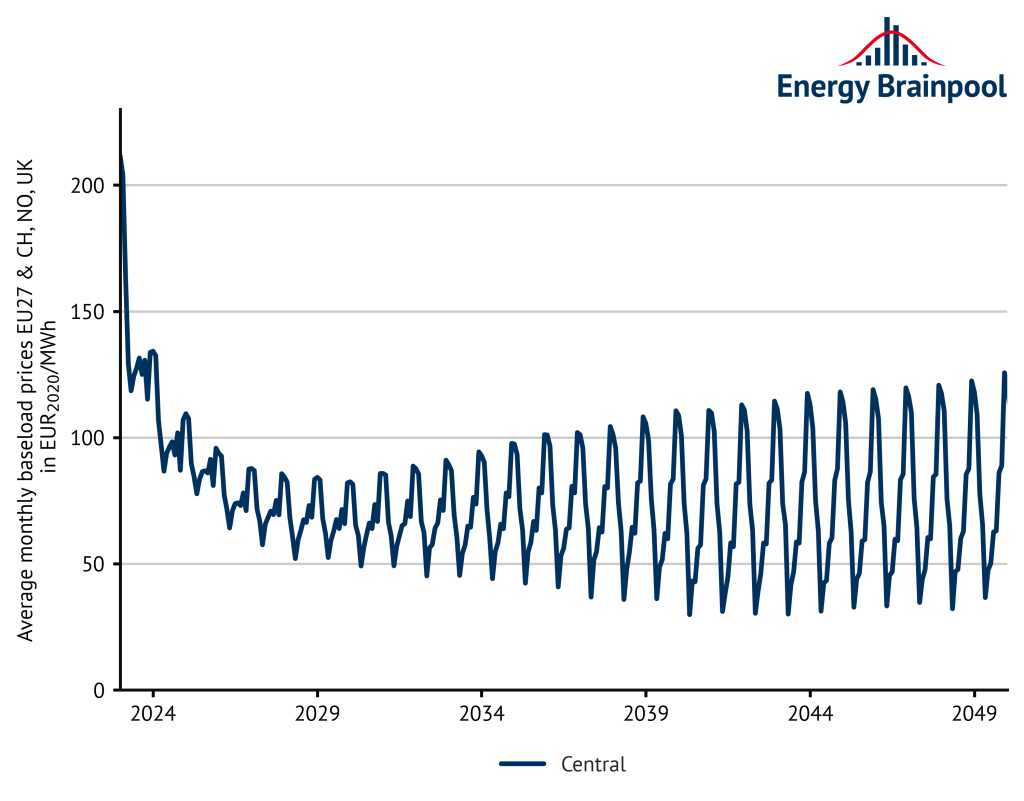
Figure 8: monthly baseload prices on average (source: Energy Brainpool, 2021)
What revenues can wind power plants achieve?
The sales value is the average volume-weighted power price that wind and PV plants can achieve on the spot market over the course of the year. Only generation hours with positive power prices are taken into account in the calculation (including 0 EUR/MWh).
In contrast, the sales volume indicates the share of the electricity quantities generated in these hours in the total generation quantity. The product of the sales value and the sales volume is the capture price. In contrast to the sales value, the capture price is the average annual revenue on the electricity market for the entire generation quantity (i.e. also in hours with negative electricity prices).
Market value and the capture price for wind almost constant from 2030 onwards
As Figure 9 shows, both the market value and the capture price for wind remain almost constant from 2030 onwards and only increase slightly at the end of the period under consideration. Increasing capacities are the reason for this. The parallel generation by a higher number of plants reduces the power prices in these hours (merit order effect). The sales volumes almost do not decrease at all on average in the EU. But in some countries, such as Germany, they decrease very significantly.
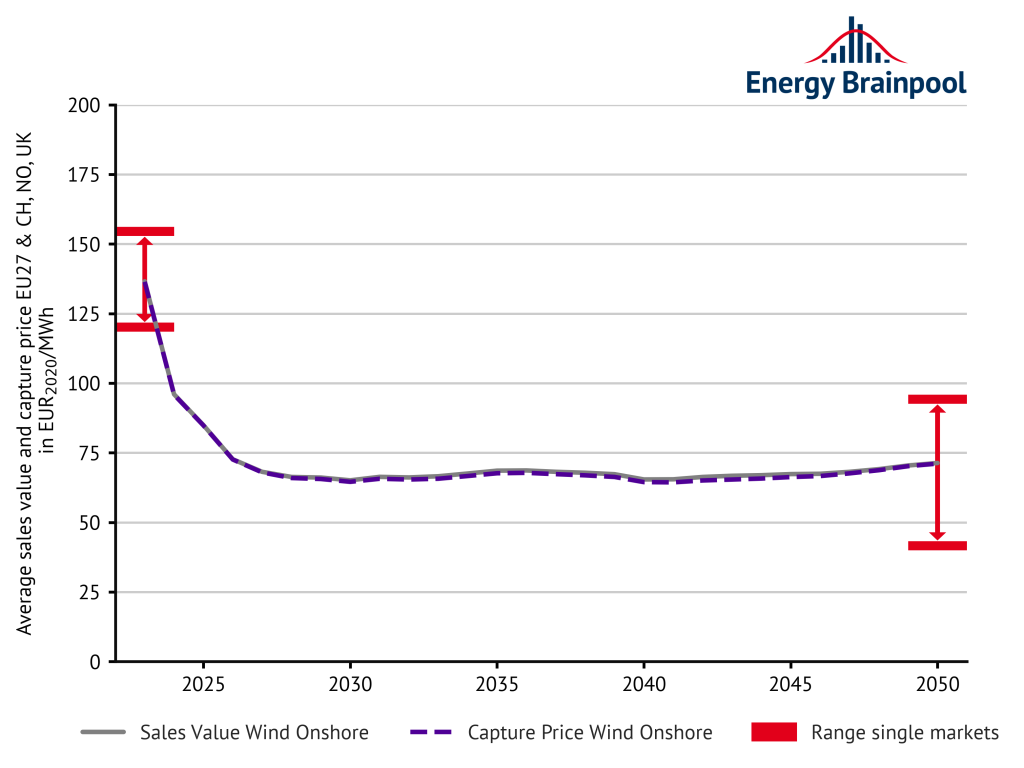
Figure 9: sales values and volumes for wind on average (source: Energy Brainpool, 2022)
In general, the many hours enable positive revenue streams in which, despite the high share of renewable energies, dispatchable fossil power plants set the price. The fluctuation of the markets shows how different the country-specific average revenue opportunities of wind power plants are.
In the white paper “Assessment of electricity market revenues of fluctuating renewable energy plants”, Energy Brainpool defines, among other things, the indices sales value and sales volume. These indices make it possible to assess the revenue potential of fluctuating renewable energies realistically on the electricity market.
What revenues can photovoltaic (solar) systems achieve?
The development of the average sales value and capture price of photovoltaic systems falls more sharply than wind in the 2040s (cf. Figure 10). The reason for this is the significant expansion of PV capacities, especially in Germany, in conjunction with the strongly pronounced simultaneity effect for PV. This is because the majority of electricity is generated during the daytime hours in summer. In hours when a lot of solar power is generated, power prices fall and with them the revenues.
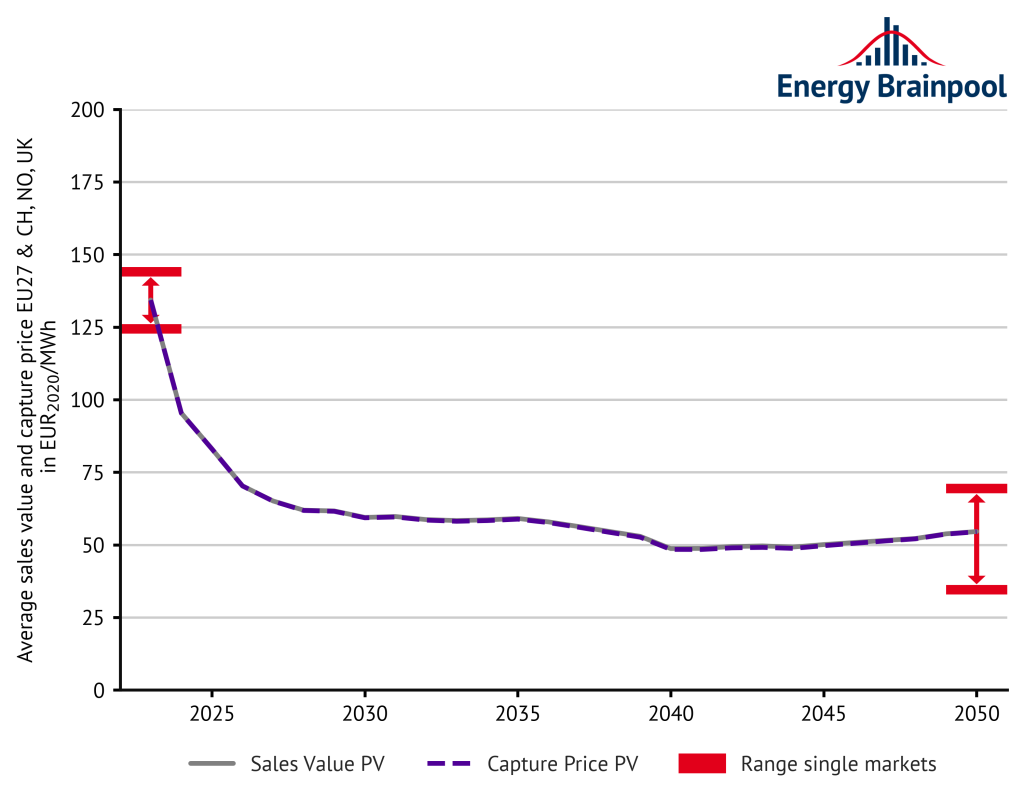
Figure 10: sales values and volumes for solar on average (source: Energy Brainpool, 2021)
For PV, too, the sales volumes remain almost constant on average in the EU. Meanwhile, in individual countries there are at times significant decreases. The wide fluctuation in solar sales values in the individual states shows how strongly the revenue opportunities vary. However, in a sunny country high revenues are possible even with low sales volumes. The reason for this is that the plants are better utilised.
Fluctuations due to different scenario assumptions
Energy Brainpool currently offers three scenarios. Figure 11 shows the different trends of the scenarios. The difference between the scenarios relate to the assumptions on the development of commodity prices as well as the power plant fleet and flexible electricity demand.
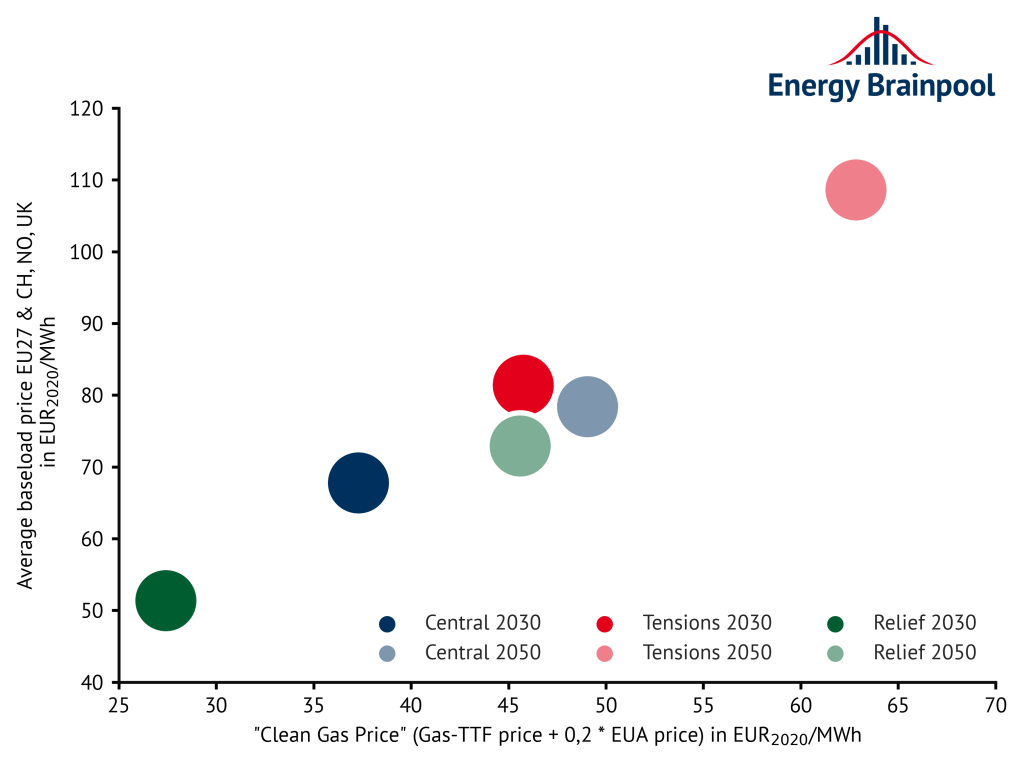
Figure 11: trends in the different scenarios (Source: Energy Brainpool, 2022)
In the “Tensions” scenario, the current tensions between Russia and the West will continue in the coming years. As a result, high commodity prices continue to be observed on the futures markets. Europe stops importing Russian pipeline gas as early as possible. As a result, the price of natural gas is oriented towards the world market price for LNG. European consumers are in competition for LNG with the Asian markets. In the medium term, this also leads to a high natural gas price level.
At the same time, compared to the “Central” scenario, there is an increase in CO2 prices. This happens both to generate additional revenues to refinance public debt and to promote technological development in the use of hydrogen. In Germany, the expansion of renewables is proceeding more slowly than planned.
In contrast, the “Relief” scenario assumes that the relationship between Europe and Russia will ease again in the coming years. Consequently, the import of Russian pipeline gas will continue in the medium term. The expansion targets for renewables decided during the current crisis, especially in Germany, will nevertheless be maintained. The goal is to reduce Europe’s dependence on imports of fossil fuels in the long term.
Figure 12 shows the corresponding development of average power prices in the respective scenarios.
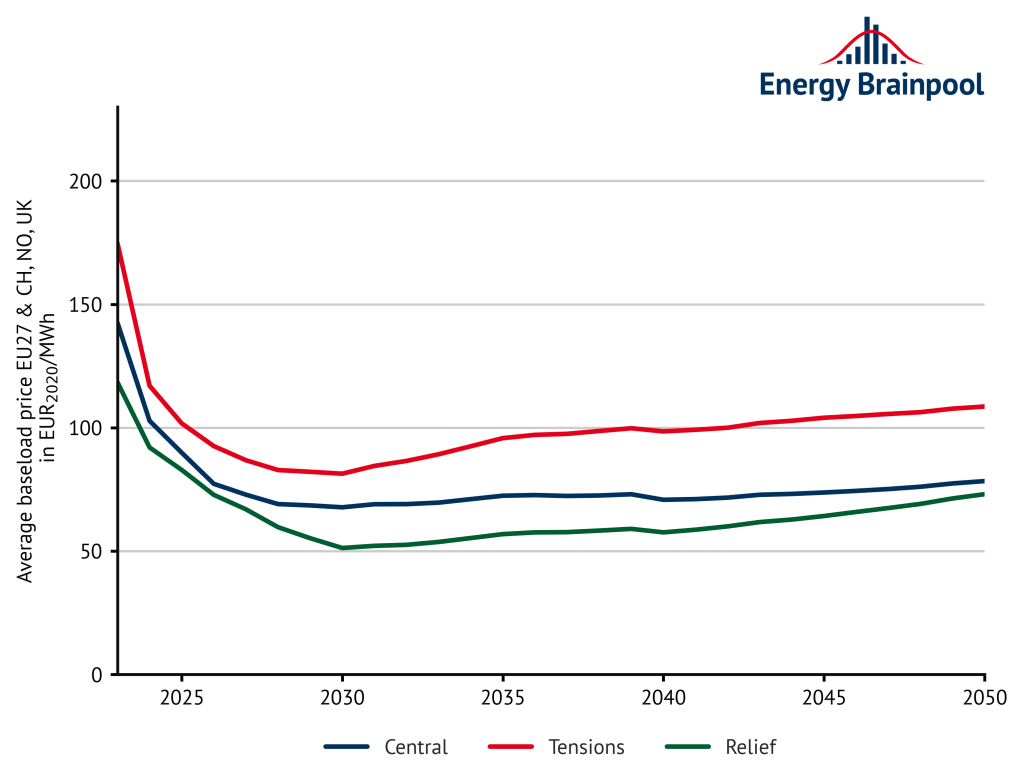
Figure 12: development of power prices in the respective electricity scenarios in EUR2020/MWh (Source: Energy Brainpool, 2022)
You are interested in the results of our last EU Energy Outlook of November 2021? Then we recommend our blogpost: Update: EU Energy Outlook 2050 – How will Europe evolve over the next 30 years?
Authors: Alex Schmitt, Christoph Kellermann, Calvin Triems, Huangluolun Zhou
[1] EU Reference Scenario, 2016: Energy, transport and GHG emissions – Trends to 2026 [online] https://ec.europa.eu/energy/sites/ener/files/documents/ref2016_report_final-web.pdf [last accessed 01.11.2021].
[2] IEA, 2021: World Energy Outlook [online] https://www.iea.org/reports/world-energy-outlook-2021 [last accessed 01.11.2021].
[3] entso-e, 2021 [online] https://tyndp.entsoe.eu/ [last accessed 01.11.2021].
[1] In this scenario, Energy Brainpool defines three goals: stabilisation of climate change, clean air and universal access to modern energy. In particular, it is assumed that the majority of industrialised countries will have reduced their CO2 emissions to “net zero” in 2050, thus limiting the increase in the global average temperature to 1.65 °C.


26. July 2023
Dear Energy Brainpool,
Thank your for this insightful study.
I have a question on figure 7 (average baseload price): If I have understood correctly, the base load price is the price to produce the minimum level of demand (the base load). Is the base load price you have in the analysis based on end-use or wholesale price? And can we assume that this is a conservative price forecast, as taking peak loads into account would push the price up?
Also, I was wondering if you have made any other electricity generation/wholesale price forecasts for other countries.
Thank you in advance for your answer!
Pauline
11. August 2023
Dear Pauline!
Thank you for your question! We use the term “baseload price” for the annual average across all 8760 hourly whole-sale prices. In other words, it includes both peak hours (Monday to Friday, 8 am – 8 pm) and off-peak hours. Hence, hours with a high load are also taken into account.
As for your second question, we compute our power price scenarios with a model that includes all European countries. We currently do not do any modeling of countries outside of Europe.
Kind regards
team of Energy Brainpool