On Saturday, August 19th 2017, as well as on Sunday, August 20th 2017, a high production of variable renewable energies hit a low demand. The primary causes of this are the weekend and the holiday period. On both days, negative prices occurred at noon over a maximum period of five hours, so that the production was not affected by § 51 EEG 2017.
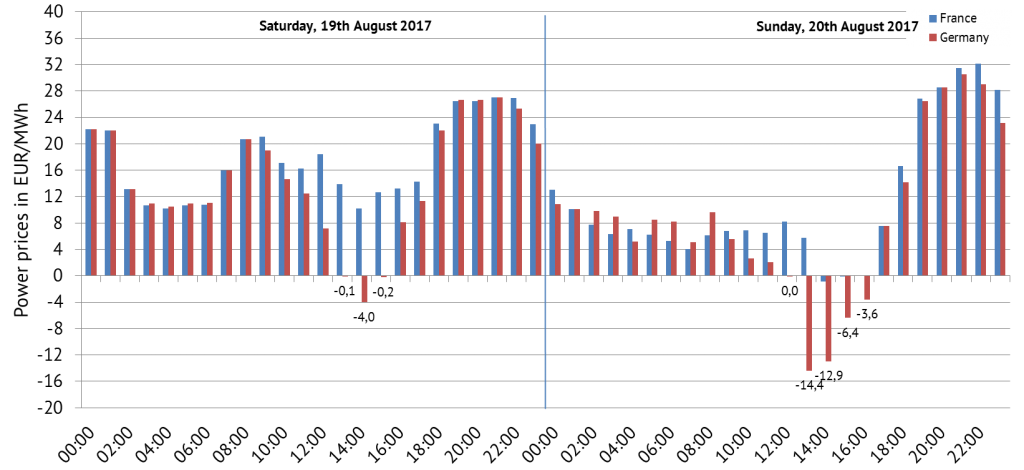
On Saturday, the prices for Germany at the day-ahead market of the EPEX Spot were below 0 EUR/MWh for three hours. The lowest price was minus 4 EUR/MWh. On Sunday, when the demand is even lower than on working days and Saturday, here even five hours were negatively priced with up to minus 14.4 EUR/MWh). (cf. figure 1)

Figure 1: Electricity prices at the day-ahead market in Germany and France, source: EPEX Spot SE, own figure
While on Saturday the prices in France were still positive, there were also negative prices on Sunday.
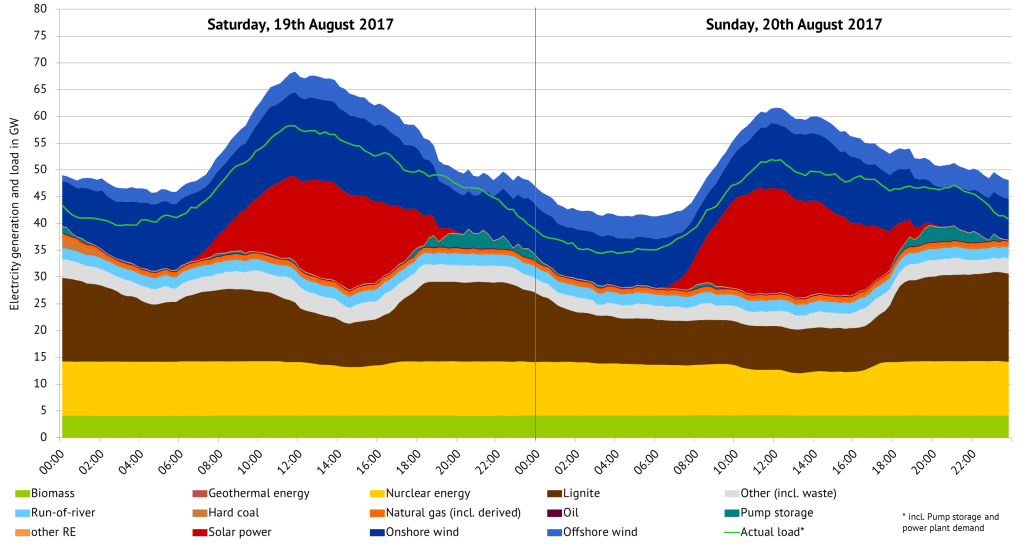
The generation of solar power increased to more than 18 gigawatts on Saturday, based on data from ENTSO-E Transparency. Since wind energy produced more than 19 gigawatts, the demand was covered by 65 per cent by these two technologies. The production of controllable conventional power plants decreased significantly. Hard coal power plants generated only a few hundred megawatts from the early Saturday morning, while the generation was around 2 gigawatts in the night from Friday to Saturday. Lignite power plants reduced the output from 15.6 gigawatts to 8 gigawatts in the afternoon and increased the production again in the night.
Nuclear energy contributed a power reduction of about one gigawatt (minus 10 per cent compared to the maximum production on Saturday). This corresponds to the power of one nuclear power plant. Pump storages used about 4 gigawatts of generation for storage. There was no significant reduction of biomass plants (minus 2 per cent), run-of-river (minus 6 per cent) and waste energy (minus 3 per cent) according to the data.
Figure 2 shows the generation and the demand on Saturday and Sunday for Germany.

Figure 2: Electricity generation and load in Germany, source: ENTSO-E Transparency, own figure
On Sunday, the peak generation of solar energy increased again by 1.5 gigawatts, the generation of wind energy was around 3 gigawatts lower than the day before. Additionally, demand declined. The highest demand was around 6.3 gigawatts lower than on Saturday.
Due to these factors, more negative prices could occur than on Saturday. Partially, more production was reduced in comparison to Saturday. Nuclear energy reduced the output by 2.3 GIGAWATTS. This is equivalent to two nuclear power plants. Other technologies, for example lignite power plants, decreased the production comparable to the level of the previous day.
On both days, Germany continuously exported electricity. Up to 12 gigawatts could be distributed to other countries. Figure 3 shows the development of the net imports of Germany (negative values represent exports). Physical cross-border flows are actual electricity flows between countries, due to electricity generation and consumption of the European countries.

Figure 3: Balance of imports and exports of Germany, source: ENTSO-E Transparency, physical flows, own figure
Note: Generation, Demand and physical flows are based on real time values whereas the spot market prices in figure 1 are showing day-ahead values, based on forecasts. Because of balancing and intraday markets as well as unexpected developments, the power system data cannot be solely used to interpret and explain the day-ahead prices. Generation data from ENTSO-E Transparency is not complete. Data for generation from hard coal and gas power stations is only covering a small part of the overall generation, compared to other available sources.


What do you say on this subject? Discuss with us!