While the world looks in surprise at negative prices on the oil markets, these have long been familiar to participants on the electricity market. However, the market results on the electricity exchanges are also anything but normal now: For the first time ever, the price for a baseload delivery falls below zero on a working day.
What is currently causing this price turbulence and why are some European countries more affected than others are?
Assessment of the current price situation
Looking at the results of the German day-ahead auctions on the EPEX Spot power exchange, one can quickly observe an exceptionally low price level. After the prices for Sunday, 15 March 2020 dropped significantly into negative territory, this became a weekly routine. On the third weekend of April, this repeated itself for the sixth time.
Thus, the current year 2020 already has 168 hours with negative prices (as of 21 April 2020). In the entire calendar year 2019, there were 211 – a previous record. Moreover, April has so far delivered considerably more hours with settlement prices below 0 EUR/MWh (40) than above 40 EUR/MWh (12).
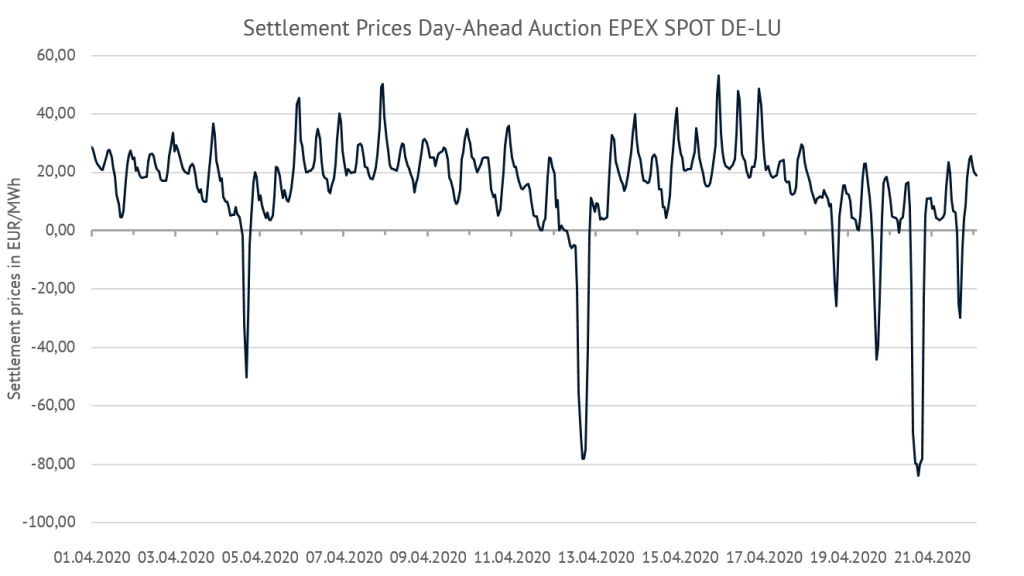
Figure 1: settlement-prices day-ahead-auctions EPEX Spot in the bidding zone DE-LU, Source: EPEX SPOT, ENTSO-E
As shown in Figure 1, price developments are particularly significant between 19 and 21 April. The price for a baseload delivery of electricity on Tuesday, 21 April 2020, fell to -16.15 EUR/MWh. This was the first time ever that the price average for a working day was negative [1]. In the peak load period from 2 PM to 5 PM, prices remained consistently below -80 EUR/MWh.
A look at the European neighbours in Figure 2 shows a similar picture, but also raises questions. A very low electricity price level can be confirmed – negative prices occurred in all bidding zones.
However, the number and intensity of these hours, as well as the resulting average price, are unequally distributed. The latter was at least 20 EUR/MWh lower in Germany than in neighbouring countries. Only Belgium is an exception and shows figures very similar to Germany.

Figure 2: Day-ahead auction results Tuesday, 21 April 2020 EPEX Spot in the respective bidding zone, Source: EPEX Spot
To explain the large differences between countries, it is important to understand the reasons for the generally low price level. In this context, it is helpful to look at the well-known factors of price building: supply and demand.
Decline in demand and record supply of renewable energy face each other
We now know, that the measures to limit the coronavirus pandemic have led to a Europe-wide drop in demand for electricity. In particular, the temporary shutdown of entire industrial chains, for example in the automotive industry, has resulted in noticeably lower electricity consumption.
As data from ENTSO-E Transparency shows, the average actual load in the first 19 days of April 2020 was 49,476 MW, 13 percent below the figure for the same period last year. Although, it should be noted that April 2020 counts two weekends and one holiday more than April 2019 to this point.
Furthermore, the average temperature of the current month is slightly higher. However, if one compares only working days, the average is still 10.5 percent below the previous year’s value. Thus, the demand side in particular is responsible for a fundamentally subdued electricity price level, which has been a factor since mid-March.
In addition, conventional power plants experience low marginal costs due to the sharp drop in prices on the commodity and emissions markets.
What happens on the supply side?
The supply side, on the other hand, is where we find the reasons for the at times extreme drop in prices, especially in the period between 19 and 21 April.
A special weather constellation provided an unusually high number of sunshine hours [2]. In almost all parts of Germany, more than 200 hours of sunshine accumulated in April. This is far more than the average [3]. Last weekend strong levels of wind additionally led to a high output from onshore wind plants.
This led to an extraordinary event on the electricity markets: a significantly above average feed-in from solar and wind power plants – at the same time. Figure 3 shows how strong this feed-in was.
At the time of the day-ahead auction for 21 April, the joint output of solar and wind onshore plants was forecasted to peak at just under 57.9 GW. This was well above the four peak days in 2019, which are provided as a reference.
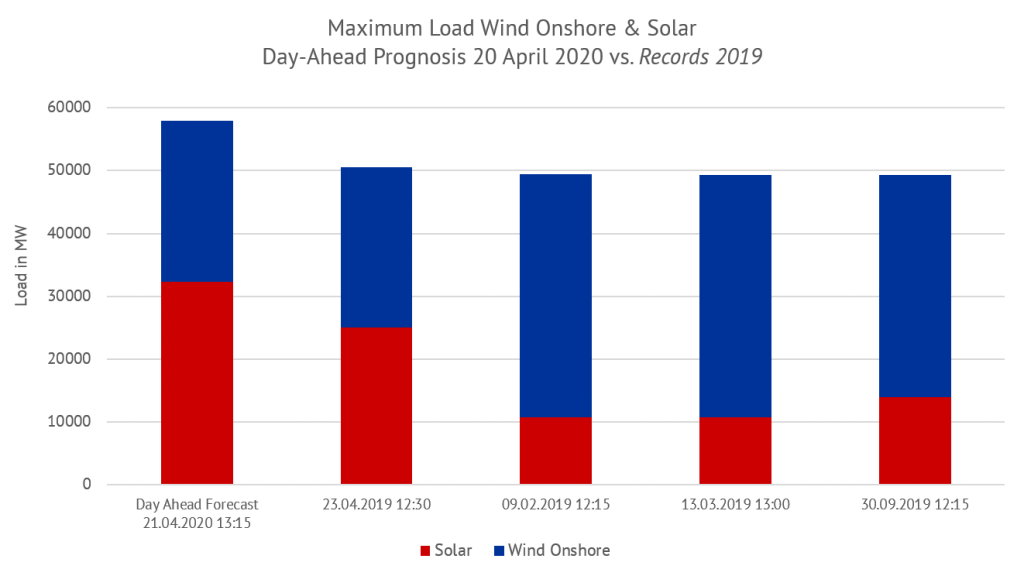
Figure 3: Joint load wind onshore & solar. Only maximum value for the respective day. Source: ENTSO-E Transparency.
In summary, weak domestic demand, together with the low marginal costs of conventional power plants, laid the foundation for the low price level. Consequently, a record level of renewable feed-in at times made it possible to push the price of electricity into to unchartered territory.
Renewable capacity and conventional flexibility: how the differences between European prices can be explained
Considering the significant differences in electricity prices on the European markets, the above mentioned supply and demand effects play a significant role. The decline in demand is different in each country. This depends on the degree of “shutdown” measures and the share of industrial electricity consumption in total demand.
In addition, the weather situation is certainly not exactly the same in each case. However, to explain the differences of over 20 EUR/MWh for the average price, two more factors are important: the share of renewable energy plants in the power plant fleet and the flexibility of its conventional power plants.
If the conditions for generating energy from wind and solar sources are optimal, the question arises to what extent these can be utilized. A decisive factor here is the size of the renewable generation fleet available to the respective countries. This is shown in Figure 4 as a relative share of total installed capacity in 2020.
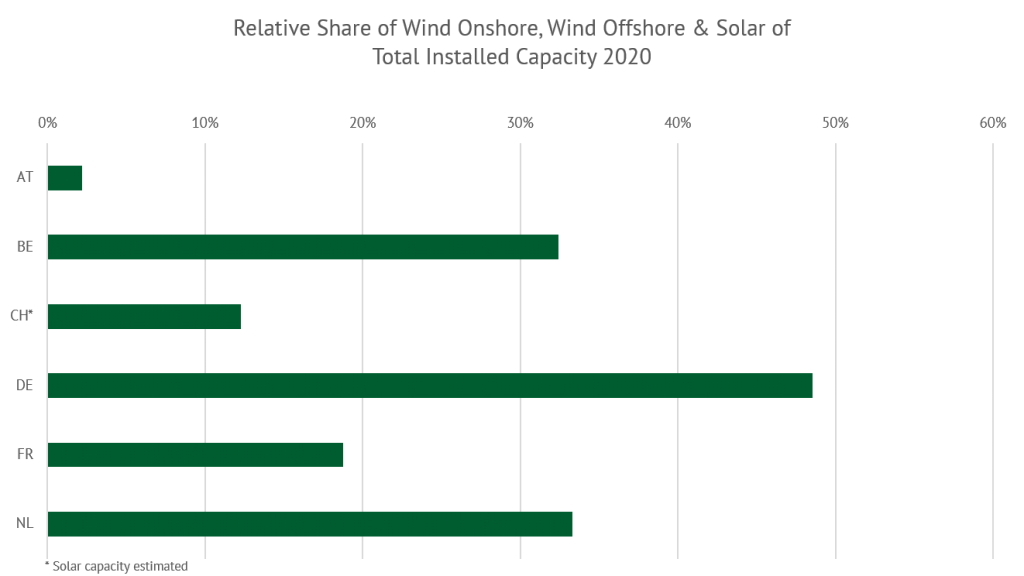
Figure 4: relative share of wind onshore, wind offshore and solar of the total installed capacity 2020. Source: ENTSO-E, Schweizer Bundesamt für Energie
A comparison of the installed renewable capacity with the prices achieved on 21 April 2020 suggests that countries that were able to benefit particularly from the weather situation in the form of electricity production also experienced more negative electricity prices.
Putting the amount of electricity produced from renewables in relation to the electricity demand makes this relationship even more transparent. Especially Germany and Belgium, which both had extremely negative prices, stand out clearly.
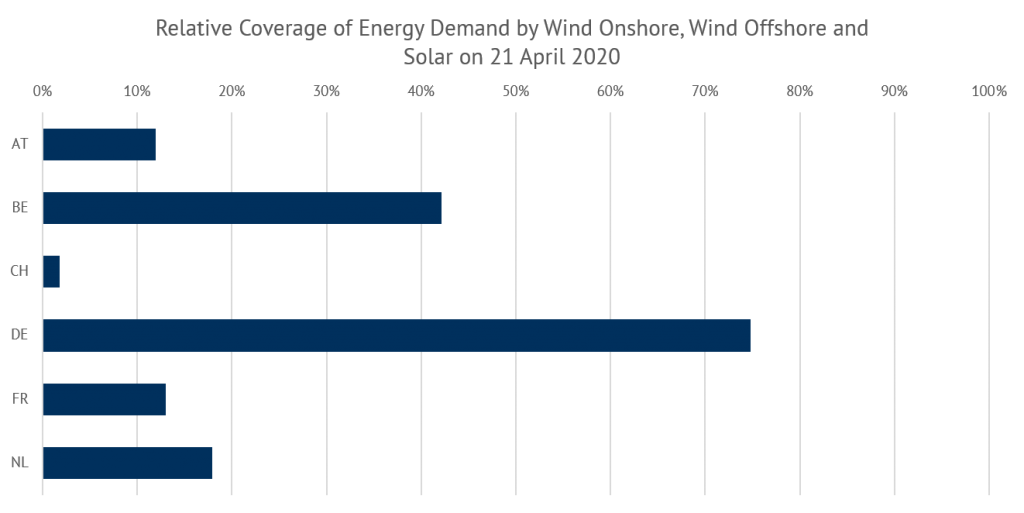
Figure 5: Relative coverage of energy demand by wind onshore, wind offshore and solar on 21 April 2020, Source: ENTSO-E Transparency, Source: ENTSO-E Transparency
The second factor influencing the resulting price in the case of strong renewable feed-in is the ability of conventional power plants to react instantaneously to a price level below their marginal cost.
While gas-fired power plants, for example, can do this very well, reducing production or even shutting down nuclear power plants is a lengthy and cost-intensive process.
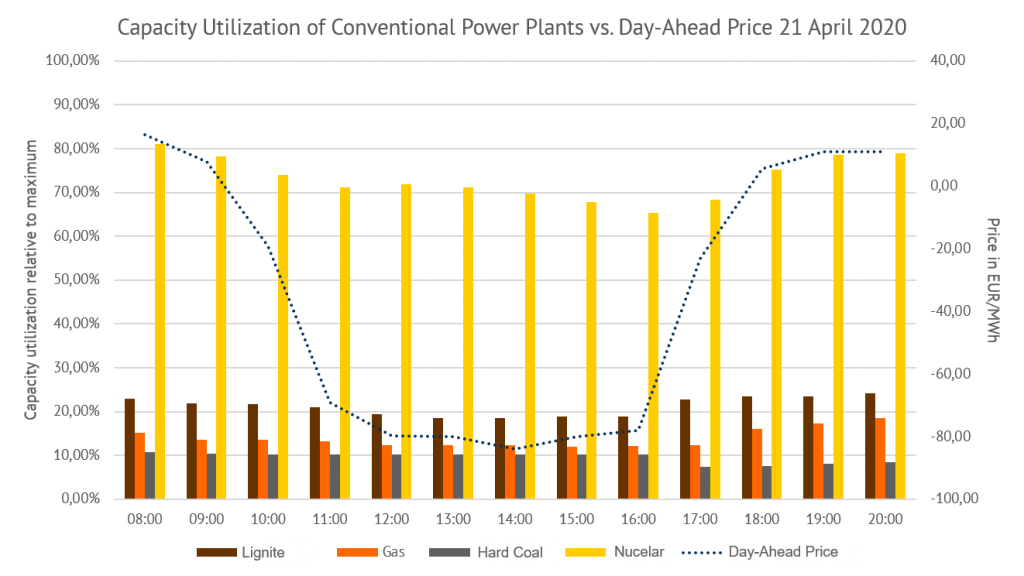
Figure 6: capacity utilization of conventional power plant fleet relative to its maximum in 2020. Possible maintenance or outages are not considered; Day-ahead power price EPEX SPOT bidding zone DE-LU on 21 April 2020, Source: ENTSO-E Transparency, EPEX SPOT
As Figure 6 shows, nuclear power plants were only able to react slightly to the negative prices on 21 April. However, hard coal and gas-fired power stations reduced their output to just under 10 percent each at 2 PM. Considering that nuclear power accounts for only 15 percent of the total conventional capacity and that conventional power plants had to cover a residual load of 14.2 GW as early as 6 PM (biomass and hydro are not considered), it can be assumed that in terms of flexibility a minimum conventional generation level was indeed reached.
Developments in neighbouring EU countries
The extreme rigidity of nuclear power plants placed a significant burden on other countries. In Belgium, for example, the share of nuclear capacity in relation to the total capacity is still 24.8 percent, and 45 percent in relation to the conventional power fleet. This provides an explanation why electricity prices in Belgium reached the same or an even lower level than in Germany despite 30% less renewable electricity in the system.
In the other neighbouring countries, the amount of renewable energy does not appear to have been large enough on 21 April 2020 to bring the price of electricity down to a level similar to that of Germany or Belgium. Nevertheless, France, with a nuclear capacity share of almost 50 percent, had six hours with negative prices. Moreover, this, despite the fact that the amount of renewable generation covered only 13 percent of demand on that day.
Conclusion
In summary, it can be shown that in Germany the high level of renewable generation capacity played a greater role in the extreme price decline than the lack of flexibility. Renewable feed-in records are generally a good sign for the environmental sustainability of the energy system.
However, the consecutive energy system is not yet prepared for such a high proportion of renewable feed-in. If they persist, the resulting negative electricity prices do not form a long-term sustainable revenue base for conventional power plants. This development is less threatening for electricity from subsidised renewable energies. The current subsidy model compensates for the loss of income from selling the electricity.
However, due to the loss of subsidies under the 6-hour rule (§ 51 EEG) and the discontinuation of subsidies for old EEG plants from 2021 onwards, this insurance against a drop in prices has also cracked seriously for EEG plant operators.
It is important to note that the current situation is an exceptional one – on both the supply and the demand side. Once electricity consumption returns to normal levels, negative baseload prices should be out of reach for the time being. But perhaps in ten years we will look back on this period and say: “That was the first time we really saw it”.


What do you say on this subject? Discuss with us!