Coal-fired power generation is sinking, wind is disappointing in tenders for renewable energies and PV is booming, and the National Hydrogen Strategy is making progress – these were the big issues in February.
Summary: Electricity generation from coal-fired power plants in the EU has fallen sharply in 2019, with implications for CO2-emissions. In tenders for renewable energies PV still beats wind in Germany. The National Hydrogen Strategy is designed to create incentives to decarbonise the transport and industrial sectors.
Coal-fired power generation falling: EU-wide emissions are falling
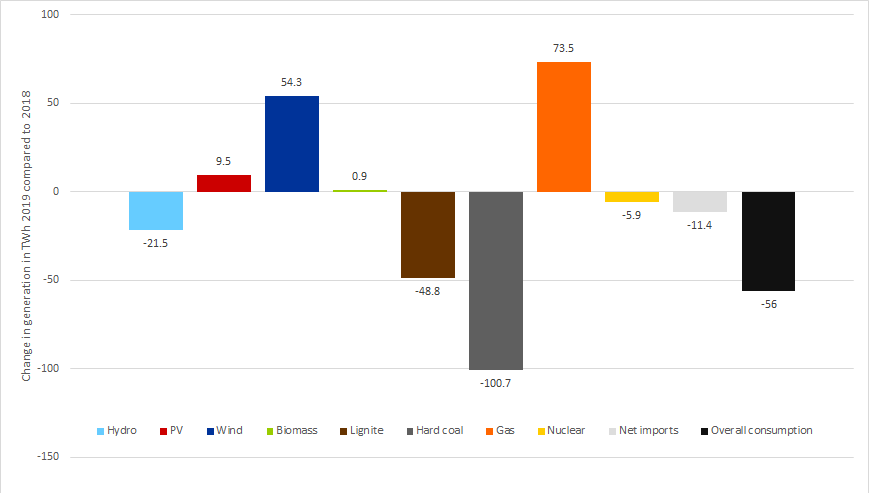
Electricity generation from coal-fired power plants in the EU dropped by 150 TWh in 2019 compared to 2018. This represents a 24 percent drop. Particularly generation in hard coal fired power stations went down. 80 percent of this decline can be attributed to Germany, Spain, the Netherlands, the United Kingdom and Spain.
In the case of lignite, Germany and Poland were responsible for two thirds of the decline in generation (source: Agora Energiewende).
At the same time, electricity generation from wind and solar rose by 64 TWh. The share of renewable energies in gross electricity generation rose to 34.6 percent. A significant factor were higher CO2-prices in the EU Emission Trading System. In detail, they rose to around 25 EUR/ton in 2019, making coal-fired power more expensive compared to alternatives such as electricity from gas-fired power plants (+ 74 TWh year-on-year) and renewables.
The mild winter and a worsening economic situation towards the end of the year reduced the demand for electricity. This also had a positive effect on the emissions balance. Figure 1 shows the year-on-year changes in electricity generation in Europe from 2019 to 2018 (data source: Agora Energiewende).

Figure 1: change in generation by technology in TWh in the EU in 2019 compared to 2018 (Source: Energy Brainpool)
Overall, emissions from the European electricity sector fell by 120 Mt or 12 percent. This is the largest reduction in CO2-emissions in Europe to date (source: PV Magazine).
Coal imports from non-EU countries increase
A downer, however, is the increasing import of coal-fired electricity from countries outside the EU. The coal-fired power plants in these countries are not affected by the steering effect of the CO2-price of the EU Emissions Trading System. Imports into the European electricity system come mainly from Turkey, Ukraine, Morocco or the Western Balkans. Imports rose from 3 TWh in 2017 to 21 TWh in 2019 as a result of a higher CO2-price within the EU. 26 Mt CO2 are estimated to be emitted in the production of the electricity imported in this way.
Sandbag’s analysis of coal-fired electricity imports into the EU is very enlightening in this respect and makes it clear that only cross-border cooperation will enable long-term and sustainable emission reductions (source: Sandbag).
Tenders: Wind disappoints, PV booms
The first tenders for the renewable energies onshore wind and photovoltaics in 2020 brought little news. On 19 February, the Federal Network Agency announced the results of the two tenders of 1 February 2020 (source: Federal Network Agency). The tender for wind energy was still undersubscribed, while in the PV tender many of the projects submitted could not be accepted.
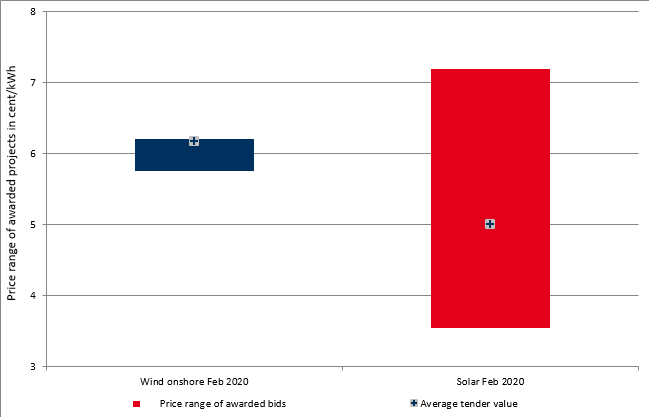
In detail, only bids with a capacity of 527 MW were submitted for the tender for onshore wind. However, 900 MW were tendered. The lull in wind energy projects is therefore continuing into the new year. At 6.18 ct/kWh, the average award value for the wind tender was slightly higher than in the tender of December 2019 (source: Montel).
PV clearly oversubscribed
This is quite different for PV. The quantity put out to tender only amounted to 100 MW, while 98 bids with a capacity of over 490 MW were sent to the Federal Network Agency: a clear oversubscription of the tender. Projects in Southern Germany´s federal state Bavaria were able to win 75 percent of the capacity awarded, with the average award value falling by 0.68 ct/kWh to 5.01 ct/kWh compared with the previous round. The lowest value of a bid awarded in Germany to date was a record 3.55 ct/kWh (source: PV Magazine).
Figure 2 shows the range of prices for the awarded bids for onshore wind and solar PV in the February 2020 tender. The difference in the range is clearly visible and illustrates greater dynamism in PV tendering.

Figure 2: average award values and range of awarded bid values of the tenders for PV and onshore wind in February 2020 in Germany in ct/kWh (Source: Energy Brainpool)
The National Hydrogen Strategy: strategy paper discussed in ministries
According to industry, network operators and research institutes, the use of hydrogen for increased climate protection efforts is necessary. With the National Hydrogen Strategy, the German government wants to set the framework for green hydrogen production and use in Germany (source: Energate). Hydrogen can be used in many sectors as a basic material or energy carrier. These include the chemical industry, but also the transport sector.
At the beginning of February 2020, four federal ministries drew up 31 measures for promoting the production and use of green hydrogen in Germany. The measures are now being discussed in the involved ministries and departments (source: BMWI). In this National Hydrogen Strategy, the key points for the future use of CO2-free and CO2-neutral hydrogen are laid down.
According to different studies, the demand for green hydrogen in 2030 and 2050 is expected to be in the order of 100 to 800 TWh. Some projects for the production or use of hydrogen are already running today.
In two further articles to be online soon we will take a closer look at the National Hydrogen Strategy, as well as the projected demand and current projects. The main take-away for now: A comprehensive transformation of the energy system will hardly be possible without chemical energy storage systems like hydrogen.
Prices at the long end rise and fall
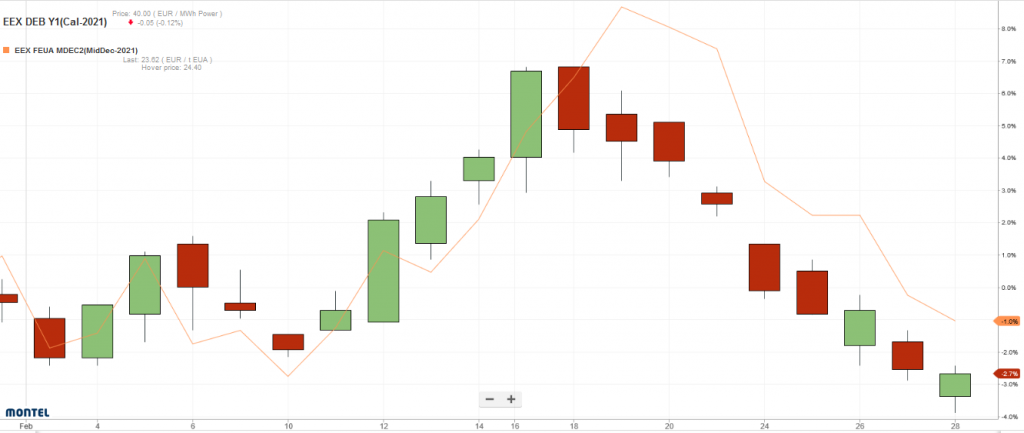
Commodity prices in February 2020 showed first an upward trend until the mid of the month and falling afterwards in most cases. For example, the calendar year 2020 reached a price of 43 EUR/MWh in mid-February, which is 3 EUR/MWh higher than at the beginning of the month. At the end of February the price stood again at 40 EUR/MWh. The price for CO2-certificates also rose during the course of February by 2.5 EUR/tonne to almost 26 EUR/tonne. They collapsed after fears of a global Corona Virus pandemic grew stronger.
Figure 3 shows the price development of the electricity front year for Germany and emission certificates in February 2020 and illustrates the strong correlation.

Figure 3: relative price development of the electricity front year base Germany (candel sticks) and CO2-certificates maturing in December 2021 (orange line) in February 2020 (source: Montel)
On the short-term market, February 2020 was all about wind. From 9 to 12 February, the storm Sabine caused wind feed-ins of 40 to 45 GW also leading to negative prices. February remained windy even afterwards, so that the share of electricity generated from this renewable sources this month stood at a record of 40 per cent or 20 TWh. Figure 4 illustrates this on the basis of electricity generation by energy source in Germany in February 2020.


What do you say on this subject? Discuss with us!