In the wake of historically high electricity prices, conventional marketing strategies for electricity from renewable energies (RE) are at stake. Until now, RE direct marketing has been equivalent to selling at spot markets, a standard that has hardly been questioned. Why should a power plant operator expose himself to the futures market risk when the EEG subsidy secures the market value on the spot market? Combined with upcoming contract adjustments in connection with Redispatch 2.0, some direct marketers are now offering guaranteed market values for the future and hedging them on the forward market. With fundamental scenario swarm analysis, you are able to indicate under what circumstances this is a good idea.
Current market situation: market values higher than EEG promotion of large-scale plants
Since July 2021 at the latest, the RE market values have exceeded the EEG support of those plants that have been awarded a contract in the tenders since 2018. These plants therefore currently receive a market premium of 0 EUR/MWh. Even for plants with higher EEG support rates, the revenue share from direct marketing is becoming increasingly relevant. This correlation is shown in Figure 1.

Figure 1: Market values of renewable energies compared to the EEG tender results 2018 to 2020 (source: Energy Brainpool, 2021)
Figure 1 shows the development of the monthly market values since 2019 compared to the range of average support values per tender round (“Anzulegender Wert”) for large-scale plants. The range varies from 43 to 66 EUR/MWh. The market values exceeded this range by July 2021 at the latest. The increase in the relevance of market revenues is the main reason why many players are now considering hedging this high price level via their direct marketers on the forward market.
How high are future market values that can be hedged today?
This depends on the one hand on the level of electricity prices on the forward market, and on the other hand on the relative value of the feed-in profile of the individual plants. While the price level on the forward market can be easily hedged with standard products on the stock exchange or as a bilateral trading transaction, this cannot usually be done for the future value of the feed-in profile.
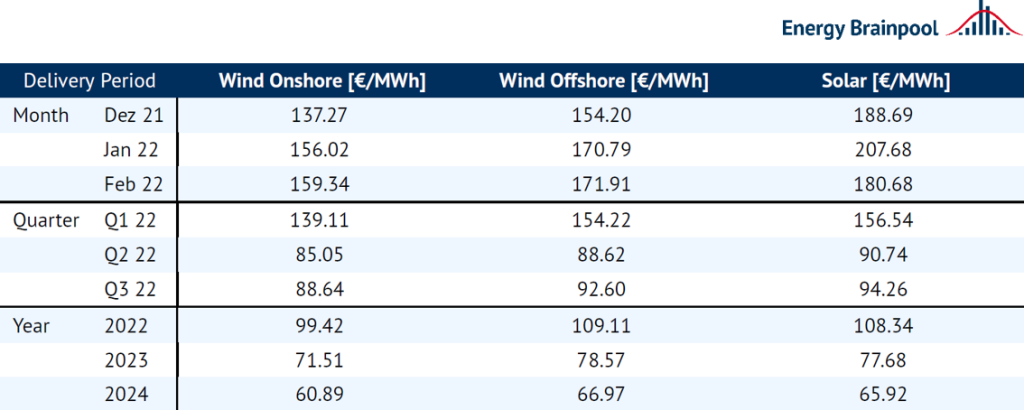
With valuation date 8 November 2021, the following average values for wind onshore, wind offshore and solar can be provided from table 1: For this winter, market values vary between 137 EUR/MWh and 208 EUR/MWh, depending on technology and month.
In the next three quarters, the value drops to between 85 and 95 EUR/MWh. Until 2024, these forward market valuations will continue to fall and will then also partly be below the values to be applied in the EEG tender again. This means: As for now price fixing of the winter months remains a relevant option for revenue optimization even for older large-scale plants with support values significantly above 100 EUR/MWh (10 ct/kWh). For the summer and the entire year 2022, this applies primarily to newer large-scale plants with lower EEG subsidy rates.

Table 1: Renewable energy price indices, forward market valuation of an electricity supply from solar and wind plants, valuation at settlement prices on 8 November 2021 (source: Energy Brainpool, 2021)
Is it reasonable to fix these market values, which are extremely high by historical standards?
No one can say with certainty today if and when lower prices will occur again on the spot market – rather, the forward market price is the average estimate of electricity traders as to what the spot market will look like in the future.
Log in market value or wait for spot market value: What is the basis for a decision?
It makes sense to take into account the most likely future scenario as seen from today’s perspective. Among other things, the spot prices of the next months and years are particularly dependent on the further developments of
- the electricity demand (including the impact of economic developments considering the Covid 19 pandemic),
- the weather (merit order effect of wind and solar feed-in, temperature-dependent heating power demand), and
- the commodity prices (gas, coal, and CO2 prices).
In the short term (i.e. on a monthly and quarterly basis), the availability of conventional power plants can also play a significant role. In principle, a fundamental electricity price analysis provides assistance in consistently mapping the price influence of various development paths of these parameters. Today, however, no statement can be given about the development of the weather for 2022, for example. If only one base scenario is calculated, it must therefore be assumed that the weather year will be as average as possible. Based on history, this average weather year has the highest probability of occurrence.
Similarly, there is uncertainty about the further trend in the economy and the commodity markets. In this case, the settlement prices of the futures market provide an indicator. These prices represent a daily updated, but risky estimate of future market prices. So here, too, it is uncertain to what extent the market-traded contracts carry an idiosyncratic risk and deviate from the fundamental value. To address these uncertainties of the short- to medium-term market development, an analysis of fundamental scenario swarms is useful to classify the futures market.
Fundamental scenario swarm analysis as decision support: Briefly explained
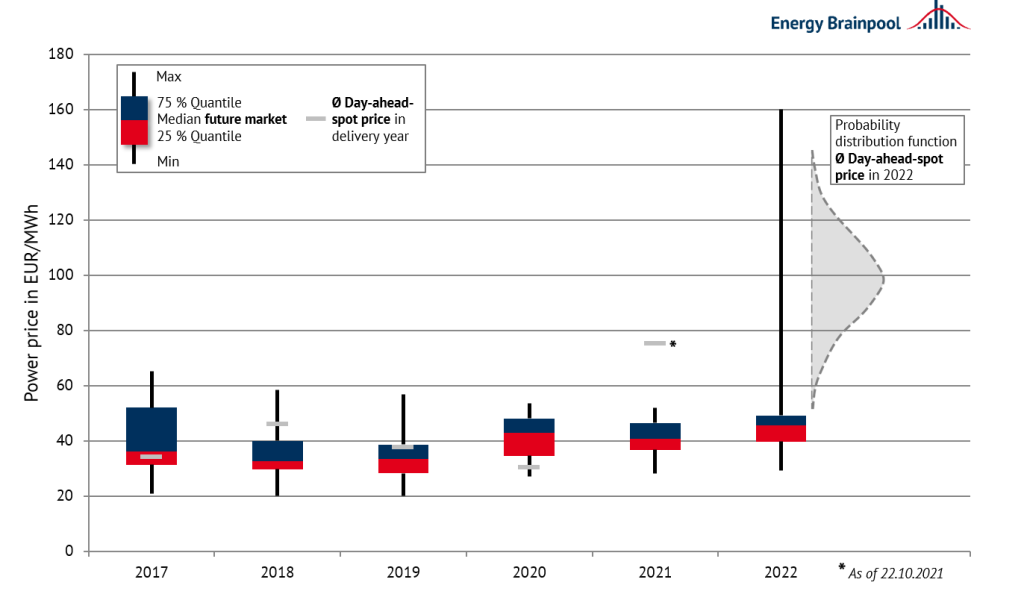
In 2018, the forward market price remained mostly below the spot market price. In 2021, on the other hand, the spot market price was significantly higher than the prices for the same year on the forward market. As shown in Figure 2, 2022 was also not priced too high on the futures market in the past, with prices only rising sharply in the summer of this year. Scenario swarms can show how likely a certain spot price level is from today’s perspective.

Figure 2: Distribution of occurred prices on the forward market until the start of delivery (boxplot) and actual spot prices (grey lines) since 2017 (source: Energy Brainpool according to EEX data, 2021)
The scenario swarm analysis is based on a combination of fundamental and stochastic analysis models (Monte Carlo simulation), allowing the calculation of more than 1,000 scenarios. In each run, the input parameters of the electricity price development described above are taken into account anew.
Quantifying price risks
An example is the weather next year, which is unknown today. Instead of one average weather year, a different weather development from a historical sample of over 30 years is modelled with each run. This enables the quantification of the price risks of a particularly cold winter or a sunny summer, for example. Also, interdependece of input parameters is considered within the analysis. The evolution of gas, coal and CO₂-prices as well as the power demand is the effect of the same modelled economic situation.
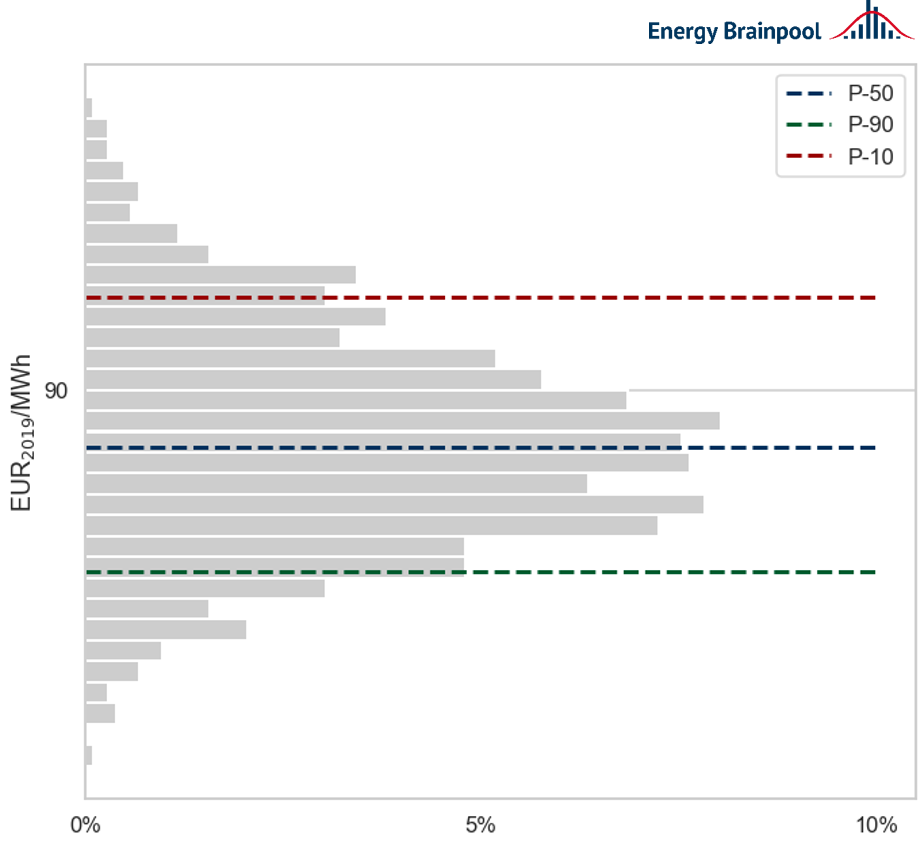
Figure 3 shows an example of how more than 1,000 scenario variations affect the annual base price in 2022. This “swarm” of scenarios can now be used to derive a frequency distribution and thus statements about quantile values (P values) and fluctuation ranges.

Figure 3: Frequency distribution of modelled marketing values for solar in 2022 in a scenario swarm with n=1000 (source: Energy Brainpool, 2021)*
Probability of the marketing value for solar plants 2022
Currently, energy traders are focusing on further gas price and weather developments. Therefore, we consider the influence of these parameters on the frequency distribution of possible marketing values for solar plants in 2022 as an example in Figure 3. The P-50 marketing value is just below 90 EUR/MWh, the probability distribution is asymmetric, possible deviations upwards are slightly larger than deviations downwards. In general, fixed marketing values of around 90 EUR/MWh are reasonable offers. But especially for solar plants, a monthly analysis is relevant, because a monthly optimization (high market values in winter, lower in summer) often further increases the revenues. Therefore, an individual analysis depending on the support value is indicated.
However, the results of swarm modeling are not independent of the respective forward market level; like all price forecasts, they have a “half-life”. The commodity price fluctuations, which are the basis for swarm scenarios, represent the volatility around the respective valid price level. As soon as the price level alters substantially, the modelled P-50 value and distribution also change. However, it is generally possible to obtain longer-term information; the results of the swarm modelling can continue to be used in the event of small to medium changes. For this purpose, the calculated 1,000 scenarios are re-evaluated on the basis of the modified parameters.
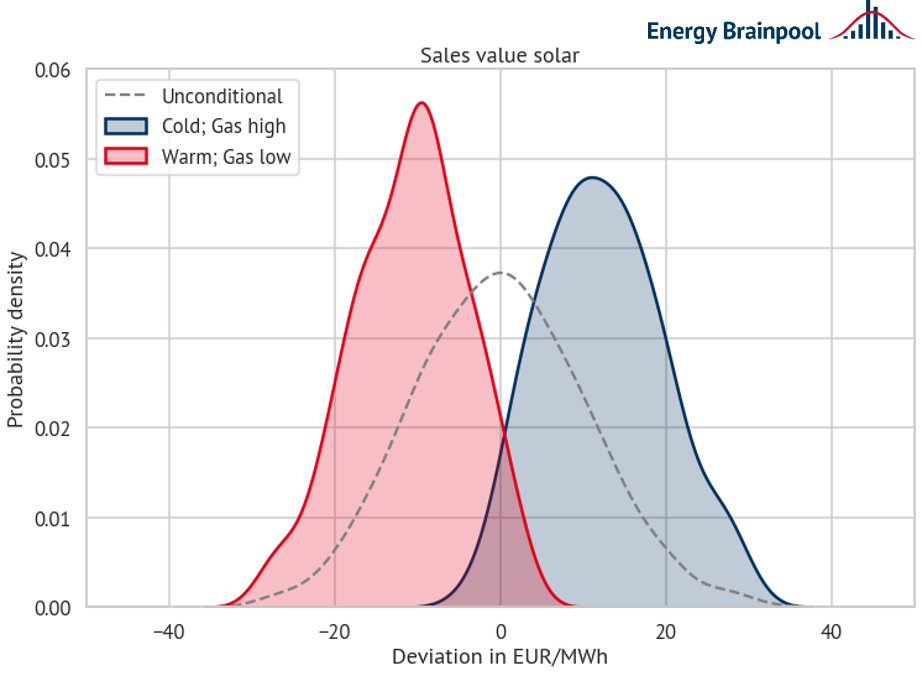
A current example based on the formative “price driver natural gas price”. Figure 4 shows the previously described re-evaluation of the 1,000 scenarios based on this decisive parameter.

Figure 4: Distribution of deviation from the mean expected marketing value solar 2022 according to fundamental scenario swarm modelling – red: electricity prices if “warm + low gas prices”; blue: electricity prices if “cold + high gas prices”; gray dashed: all scenario variants considered (source: Energy Brainpool. 2021)*
This figure shows the three different results from the same scenario swarm calculation:
The dashed gray distribution curve represents all modeled scenarios. The blue distribution considers the results of all modeled electricity price scenarios that meet the conditions of “below-average (cold) temperature” and “particularly high gas prices“. In contrast, the red distribution illustrates possible electricity price developments in the case of above-average warm temperatures and particularly low gas prices.
How can Figure 4 be interpreted?
The horizontal x-axis represents the deviation of the marketing value per scenario from the mean expected marketing value in 2022 in EUR/MWh (= mean value of the gray distribution curve around the value 0). The range of variation within the totality of all calculated scenarios is very large (= width of the gray distribution curve). If the year 2022 were characterized by cold weather and high gas prices, more than 80 percent of the results would be above the expected mean of all scenarios (see the area of the blue distribution and the mean of the gray distribution).
In contrast, warm weather and low gas prices would lead to lower prices than the expected value with a probability of about 80 percent. The left and right ends of the distribution curve are also not symmetrical. When gas prices are high and the weather is cold, the price tends to increase more than in the opposite case. A deviation of more than +/- 40 EUR/MWh, however, seems unlikely from today’s point of view.
Conclusion: Benefits of scenario swarm analyses for RE marketing
As seen in the example above, the effect of individual parameters on the frequency distribution of expected electricity prices can be quantified using scenario swarm analyses. On the one hand, these data support the decision whether and under which circumstances the RE market values should better be logged today or whether the otherwise usual spot marketing is more favourable. In addition, scenario swarm analyses can support the decision whether to leave the support scheme and switch to “Sonstige Direktvermarktung” is advisable. By doing so plant operators receive a guarantee of origin, but no market premium even if market values fall. Scenario swarm analyses show how likely it is that market values will fall below the support value. In the event of a small to medium change in the price level, the swarm scenarios can be re-evaluated and only lose noticeable significance in the event of fundamental changes.
If you are interested in modelling with scenario swarms and would like more in-depth information, you can find further details on our website.
* This graphic is for illustrative purposes. Exact details and labels are not shown in this article, but are included in the product.


