While the renewable energy levy for 2021 was politically capped in advance at 6.5 ct/kWh, there were major changes in the scenarios of the International Energy Agency’s World Energy Outlook 2020. With rising Corona figures, the commodity markets also plummeted again towards the end of October.
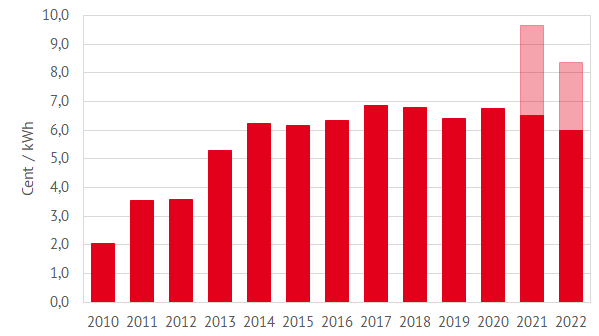
Every year in mid-October, the renewable energy levy is announced for the following year by the transmission system operators. They base their announcements on future forecasts. The levy for the coming year is 6.5 ct/kWh. In detail, the transmission system operators announced on 15 October 2020 that without the political relief measures, the levy would have risen to 9.651 ct/kWh in 2021. Thus, the levy in 2021 would be 40 percent higher than the now subsidised one of 6.5 ct/kWh.
Compared to the previous year, the federal subsidy of 10.8 billion EUR, consisting of the Corona economic stimulus package and the new CO2-pricing in national emissions trading starting from 2021, prevents an otherwise strong increase in the levy. Figure 1 shows the development of the renewable energy levy over the last decade.

Figure 1: development of the EEG levy from 2010 to 2022 (shaded area: amount of the levy without state cap) (source: Energy Brainpool)
The COVID-19-pandemic resulted in reduced power consumption. Preliminary net power demand for 2020 is expected to be eight percent lower than estimated last year (source: PV Magazine). In addition, wholesale prices have fallen, which has further reduced revenues for renewable energies. Besides that it led to a record deficit on the renewable levy account, which will have to be balanced in 2021 (source: Bundesnetzagentur).
According to the EWI, the levy could rise to 8.36 ct/kWh in 2022 if there is no state subsidy (source: ewi). Federal Economics Minister Peter Altmaier (CDU) emphasised that the renewable energy levy would be further reduced to 6 ct/kWh in 2022 (source: PV Magazine).
Major changes in World Energy Outlook 2020
Every year, the International Energy Agency publishes a comprehensive assessment of the current state of the energy world and future developments in its World Energy Outlook (WEO). The scenario paths are widely regarded as the authoritative source for medium- and long-term forecasts of supply, demand and price developments on the global energy markets.
This year, the WEO includes four scenarios. The four sceanrios are the:
- standard “Stated Policies” scenario
- progressive “Sustainable Development” scenario
- “Zero Emissions by 2050 case”
- and one scenario in which the COVID-19-pandemic is only brought under control after 2023, the “Delayed Recovery Scenario”.
Although long-term forecasts are also made, the focus is clearly on the next ten years. The reason for this are the uncertainties caused by the pandemic. In conclusion, the two identified focus areas of the WEO 2020 are, on the one hand, the effects of corona on the energy sector and, on the other, the associated prospects for energy system transformation. We have shared a more comprehensive summary of the WEO 2020 on our EnergyBrainblog.
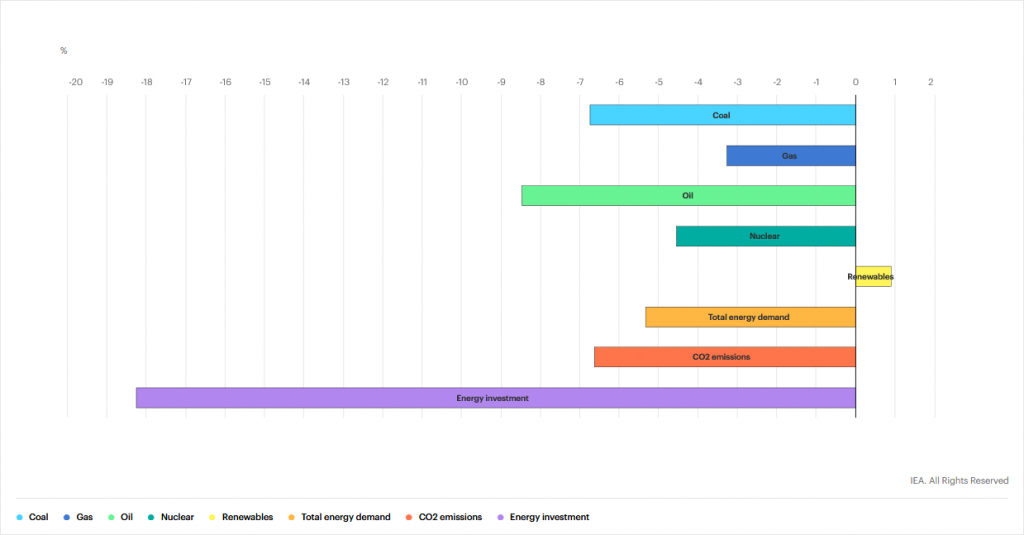
Figure 2 already gives a good overview of the impact of the corona pandemic on global energy indicators in 2020.

Figure 2: key indicators for estimated energy demand, CO2 emissions and investment, 2020 relative to 2019 (source: IEA)
Of particular relevance to us at Energy Brainpool are the changed assumptions about the long-term trends in commodity prices. In addition, it is important too see how these affect power prices and thus the sales values and revenues of renewable energies. We have also published an analysis of this.
Solar wins in innovation tenders
On 1 September 2020, the innovation auctions for renewables were held in Germany for the first time. In contrast to regular calls for tenders for wind turbines and photovoltaics, the bid in the two planned innovation calls for 2020 and 2021 is on fixed market premiums. In contrast to the regular floating market premium, which compensates for the difference between the bid value in the tender and the monthly market value on the electricity market, the fixed market premium corresponds to a payment of a fixed amount in addition to the price achieved on the electricity market over the entire funding period. Therefore, the results of the tenders cannot be compared 1:1 with those of the regular auctions for renewable energy.
Another special feature of the new tenders is that no support is paid if prices are negative. Among other things, this year’s participants were allowed to participate with a combination of PV or wind energy systems with storage facilities that feed into the grid via a common grid connection point.
Tenders are oversubscribed
According to the Federal Network Agency, 133 bids with a capacity of 1,095 MW applied for the tender volume of 650 MW in total. An oversubscription of over 68 per cent. 83 of the bids were plant combinations, the rest photovoltaic plants. No bids were received from single wind turbines.
45 photovoltaic plants with a capacity of 283 MW were also awarded a contract. The lowest winning bid was 0.96 ct/kWh, the highest was 3 ct/kWh. The volume-weighted average is 2.65 ct/kWh. 28 plant combinations, only one of which consists of a wind plant and storage, the rest of PV plants with storage, were awarded contracts for a total of 394 MW. The lowest awarded bid was 1.94 ct/kWh, the highest was 5.52 ct/kWh. The volume-weighted average is 4.5 ct/kWh.
Further rounds of tendering for solar and onshore wind were held on 1 October. The wind tender was undersubsribed by 20 per cent. The solar tender was again oversubscribed. It can be seen that despite the possibility to participate in the innovation tender, demand for solar continues to significantly exceed tender volumes.
Commodity and electricity prices fall with second corona wave
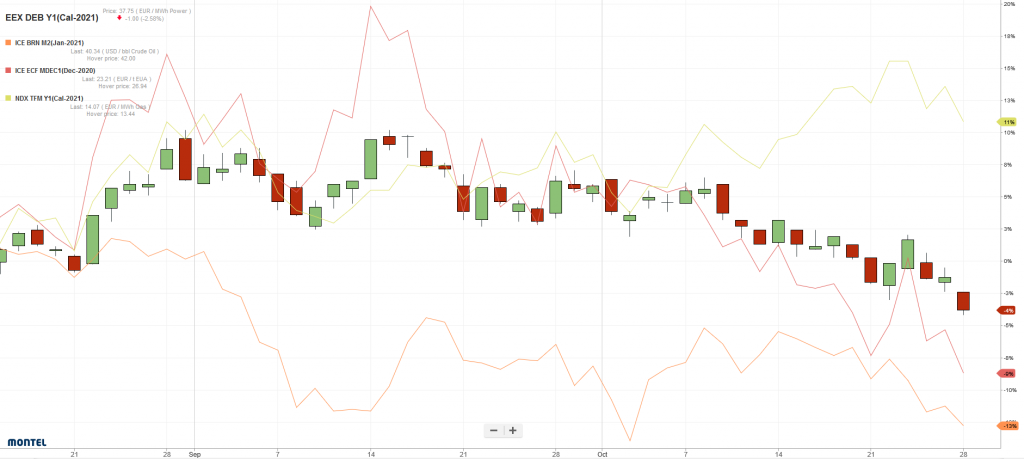
The increasing number of COVID cases and thus the fear of a new lockdown led to a drop in commodity prices in October 2020. This is intensified by the falling CO2-prices (source: Montel). Since September 2020, a drop in electricity and Brent oil prices has been observed. Coal prices follow the falling oil prices. The electricity price for the front year landed at just over 36 EUR/MWh at the end of October and could lose another 2-3 EUR/MWh over the next two months, depending on the Corona situation (source: Montel).
Gas prices showed a strong upward trend. This trend resulted from falling temperatures and the associated higher demand from the heating sector. At the beginning of the month the price was further supported by low wind and lack of gas flows from Norway due to maintenance work. The gas price for the front year reached its ten-month high at 14.68 EUR/MWh (source: Montel). After the record values of the front month on the TTF which were recorded at the beginning of the month, milder weather forecasts and the prospect of a good amount of wind caused gas prices to fall again towards mid-October 2020 (source: Montel).
Figure 3 shows the price developments of the front year electricity Germany, as well as for CO2-certificates, oil and gas since the beginning of September 2020.

Figure 3: percentage price development of the German electricity front year (candle sticks), CO2-certificates with delivery in December 2020 (red line), Brent oil with delivery in January 2021 (orange line) and front year gas at the TTF (green line) from the beginning of September to the end of October 2020 (source: Montel)
Solar volumes decline significantly in October
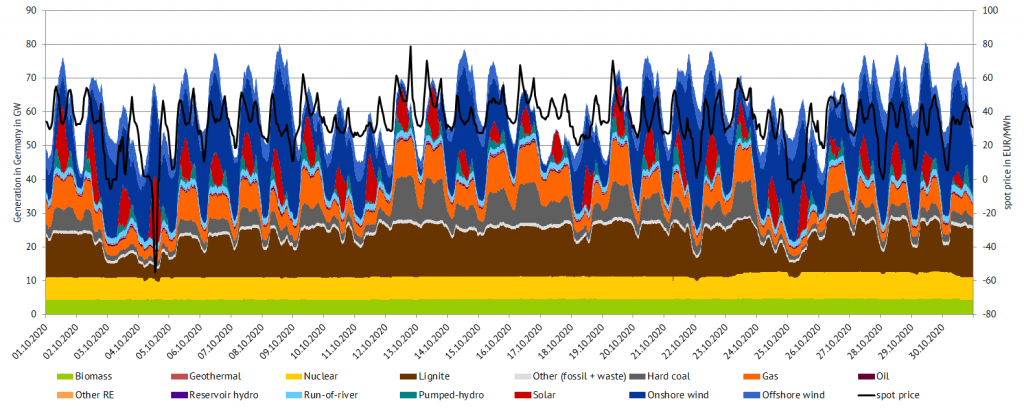
The month of October was partly characterised by high wind feeds, especially in the first and last week. The day-ahead price fell in view of the improved wind supply and the drop in energy demand feared by Corona measures (source: Montel). Due to the change of seasons, the solar feed-in decreased almost by half compared to the previous month. This can also be seen clearly in Figure 4, which shows German electricity generation from various technologies in October 2020.

Figure 4: electricity generation and day-ahead prices in October 2020 in Germany (Source: Energy Brainpool)
Authors: Naemi Schink, Sila Akat und Simon Göß


What do you say on this subject? Discuss with us!