


The number of negative spot market prices for electricity decreased in 2016. However, the price level of negative hours has simultaneously been dropping down further.
Once more in 2016 lower spot market prices for power have materialized than in the years before. On average Day-ahead power prices settled at 28.8 EUR/MWh and thus about 3 EUR/MWh below spot prices for electricity in 2015. The volatility of electricity generation, ergo the feed-in into the grid by renewables can also be perceived in power prices. Germany’s Agora Energiewende just published its report on “The energy transition in the power sector: State of affairs 2016” amongst other with data on the spot market for electricity and negative prices.
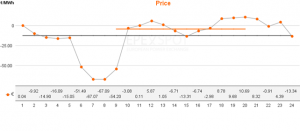
The frequency of price fluctuations (both in positive and negative direction) declined on a year-on-year comparison, while the level of high and low short-term power prices increased altogether. In 2016 just short of 400 hours featured power prices above 50 EUR/MWh (over 600 hours in 2015), however last year there have also been 30 hours with power prices above 75 EUR/MWh (only 8 hours in 2015). A similar pattern can be observed when power prices turn negative. Figure 1 depicts the number of hours with negative power prices, the average price level of negative hours and the lowest negative power price for the years 2012 to 2016 (Source: Agora Energiewende).
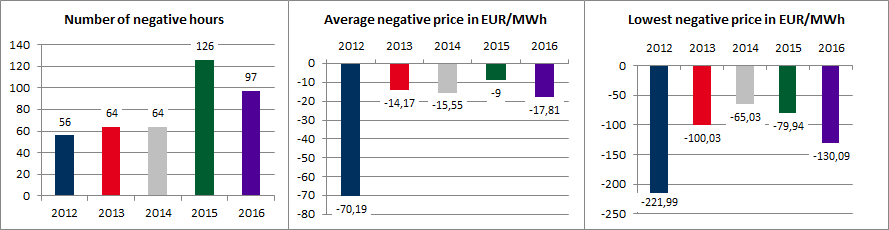
Figure 1: Analysis of negative power prices in Germany 2012-2016 (source: Agora Energiewende)
A longer period of time where electricity prices settle in the negative area are most common on weekends or holidays. Prime example: The day with the lowest negative prices in 2016, Sunday 8th of May 2016, which has been characterized with high power generation from PV and wind, each of them about 20 GW. At 1 pm on that day 86 percent of the German power consumption has been covered by renewables, while the price for power dropped below -130 EUR/MWh. With 60 GW power consumption showed an above-average value for a Sunday. Figure 2 shows power generation, consumption and the power price on that day (Source: Agora Energiewende).
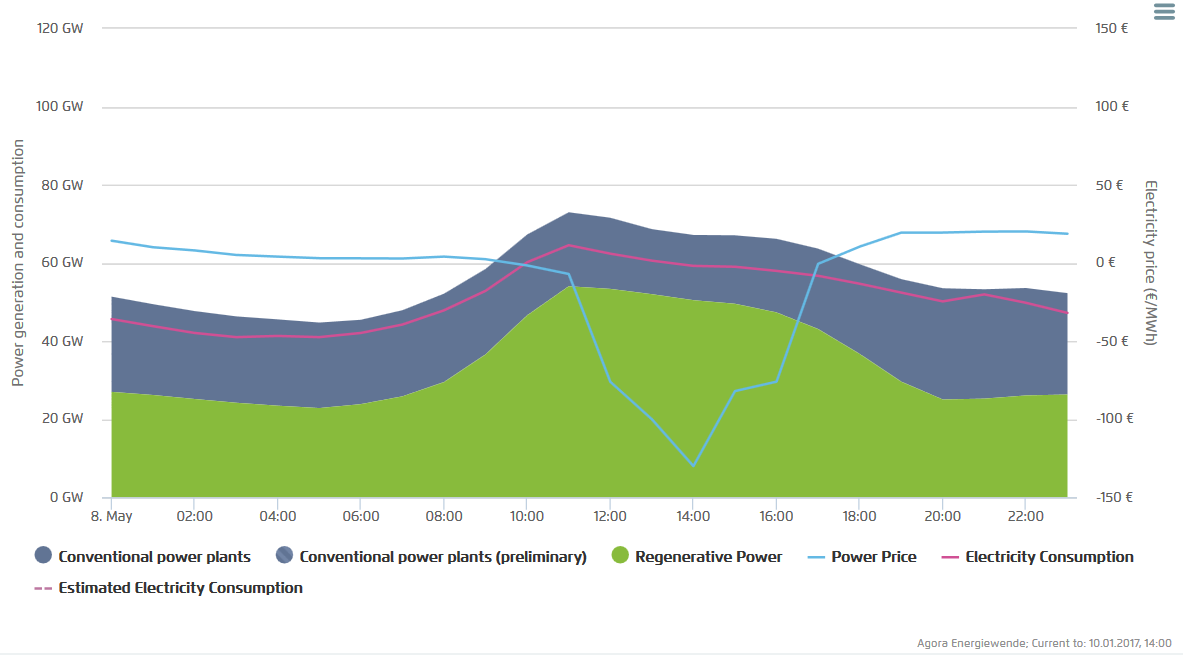
Figure 2: Power price (blue), demand (purple) and generation (green and grey) on Sunday, 08th of May 2016 (Agora Energiewende)
The above-average demand could be a first hint for flexible behavior of certain power consumers, which use more electricity in hours of low prices and high feed-in of renewable energies. Free price formation at the electricity market is an objective of the Federal Government as well, as it hopes that those price signals provide incentives for more flexibility in the power system.