After the outlook for European gas-supply security improved significantly in May 2022, current developments are worrying. First, it is announced that US LNG export capacity is limited for the near future, then Russia significantly cuts supply volumes via the important Nord Stream 1 pipeline.
In this article, the energy market experts from Energy Brainpool analyse whether and how we can achieve the European storage targets for 2022. For this purpose, they have set up a quantitative scenario estimate.
Here is a summary of the approach and the main results:
- Using historical gas storage data, Energy Brainpool evaluated four scenarios for the European storage targets. These take into account a partial or complete loss of Nord Stream 1 capacity. In addition, they incorporate limited LNG imports from the U. S. due to the outage of the Freeport LNG Export Facility for most of the remainder of the year.
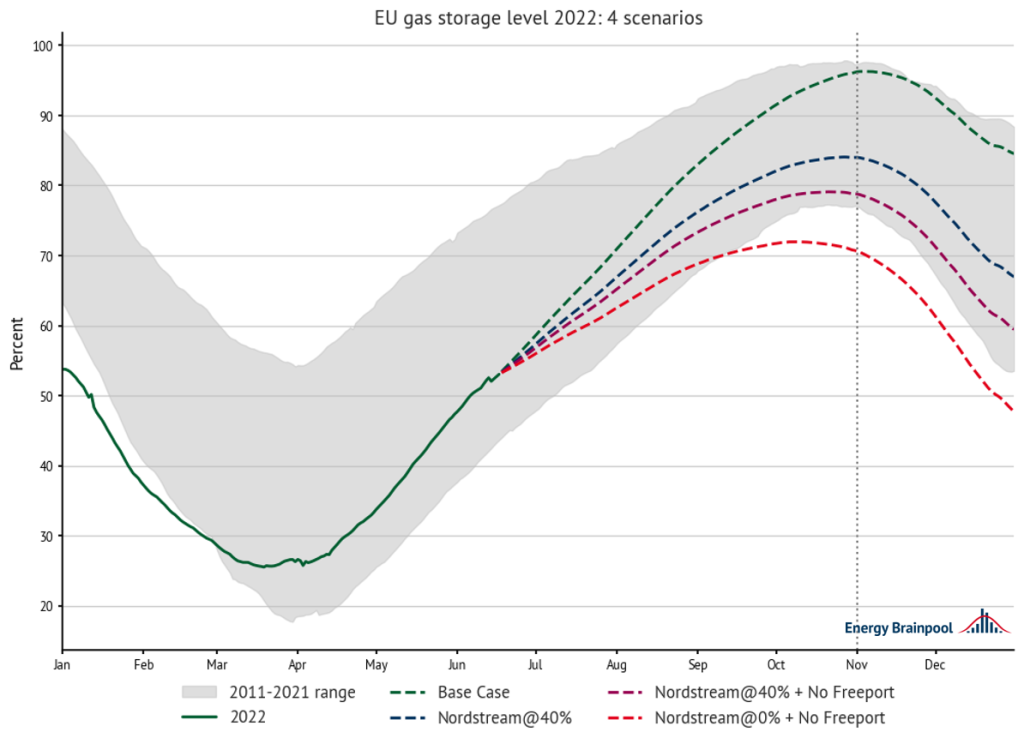
Figure 1: EU gas storage scenarios 2022, source: own calculations, EIG.
- Assuming that the outages continue and no further action is taken to increase imports or reduce demand, we can show that the EU will, on average, miss its target of 80 percent storage fill by November 1, 2022. Here, we assume that pipeline flows from Nord Stream 1 remain at 40 percent or less and that Freeport LNG Terminal does not export significant volumes by then.
- Estimates for November 1, 2022 are highly dependent on external factors such as the exact start of the heating season. A cross-year comparison of historical net storage profiles shows that storage levels for the status quo “Nordstream@40% + No Freeport” scenario by November 1, 2022, are likely to vary by up to 7 percent from the median estimate.
- To achieve a storage level of 80 percent by November 1 compared to the “Nordstream@40% + No Freeport” status-quo scenario, EU states will need to inject an additional 99 GWh/day into storage. With a storage quota of 90 percent, this increases to an additional 902.25 GWh/day.
The original outlook in May
After the severe turbulence in March and April 2022, the situation on the EU gas markets seemed to calm down somewhat in May. With record LNG imports to Europe (over 40 TWh in the first seven days of May), continued stable Russian pipeline flows via Nord Stream 1, and favourable weather conditions, the situation eased considerably in terms of filling European gas storage facilities.
According to Gas Infrastructure Europe, the gas storage deficit fell from seven percentage points at the beginning of May to just two percentage points at the end of the month; compared to the 2011–2021 average, making the target of an average gas storage level of 80 percent or more on November 1, 2022, appear increasingly likely.
The markets reacted accordingly: the front-month futures of the European gas price benchmark TTF closed at EUR 84.40/MWh on June 1. A minor sensation: lower for the first time than at the start of the war in Ukraine on February 24. Moreover, a significant positive spread formed between summer and winter contracts on the gas market.
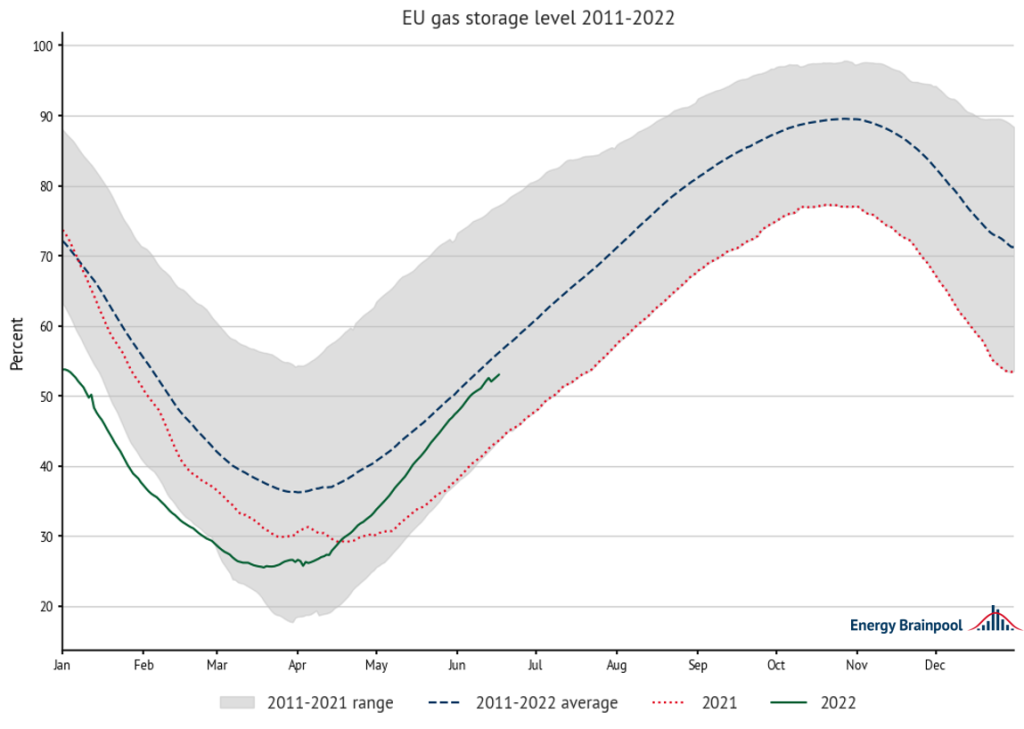
Figure 2: the EU gas storage level in 2022, compared to 2011-2022. source: own calculations, EIG.
Fire at an LNG export facility, reduced pipeline flows through Nordstream – How much volume will be lost?
In the second and third week of June 2022, the situation changed dramatically again. First, on June 8, 2022, a fire broke out at the U. S. LNG export facility in Freeport, Texas. While the operator initially declared force majeur for all exports through the end of June, the indication was updated on June 14, 2022, and now declared force majeur for all exports through the end of September. The facility is expected to be fully operational again by “the end of 2022.” The Freeport LNG Export Facility accounts for about 20 percent of total U.S. LNG export capacity.
Concern 1: Most of the LNG volumes already delivered in March.
Of even greater concern to European customers is that in March 2022, 70 percent of the volumes shipped from Freeport were delivered across the Atlantic to European customers (excluding Turkey). In March 2022, Freeport’s LNG exports to Europe totaled 1.22 bcm. It is estimated that exports have continued to increase in recent months to 1.3 bcm per month, equivalent to 420 GWh/day, which is now missing from European gas markets.
Concern 2: technical problems on the pipeline in the Baltics.
The second, more worrying news came from Gazprom on June 14, 2022. The Russian company announced that Nord Stream 1 gas flows would be reduced to 60 percent of capacity due to technical problems and lack of repair equipment at the Protovaya compressor station in the Baltics.
One day later, on June 15, 2022, Gazprom updated this assessment and reduced the flow rate to 40 percent of capacity. As a result, daily gas flows to Greifswald, Germany, fall from around 167 bcm to just 67 bcm. A loss of 980 GWh/day. There was no information from Gazprom on the expected duration of the outage. However, as the move was widely seen as “political” by European decision-makers, it can be assumed that the cuts will be permanent for the time being.
Overall, the two outages reduce European gas imports by 1.4 TWh/day.
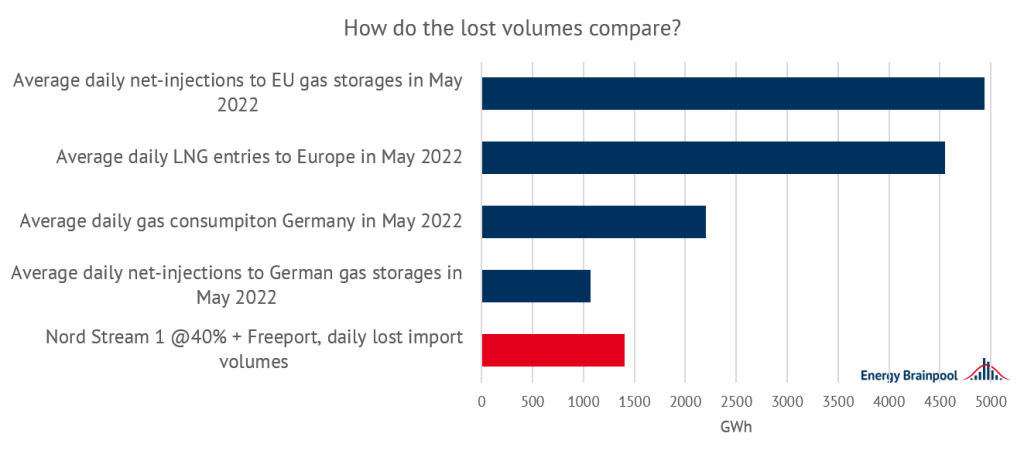
Figure 3: How do the lost gas volumes from Nord Stream 1 and Freeport compare? Source: THE, EIG, Entso-G
Interim conclusion and many open questions
Assuming that the outages continue and no additional measures are taken to increase imports or reduce consumption: How will this affect European gas storage for the coming months? Moreover, how sensitive is the outlook to temperature fluctuations and other year-specific factors?
Europe’s gas storage profile
To properly assess potential storage scenarios for the remainder of the year, it is important to consider the historical gas injection profile. Looking at the first difference in daily storage levels and thus daily net injections, the historical proportions of May 2022 become visible, where the 14-day rate of net injections exceeded the 2011–2021 cross-year average by up to 2 TWh/day.
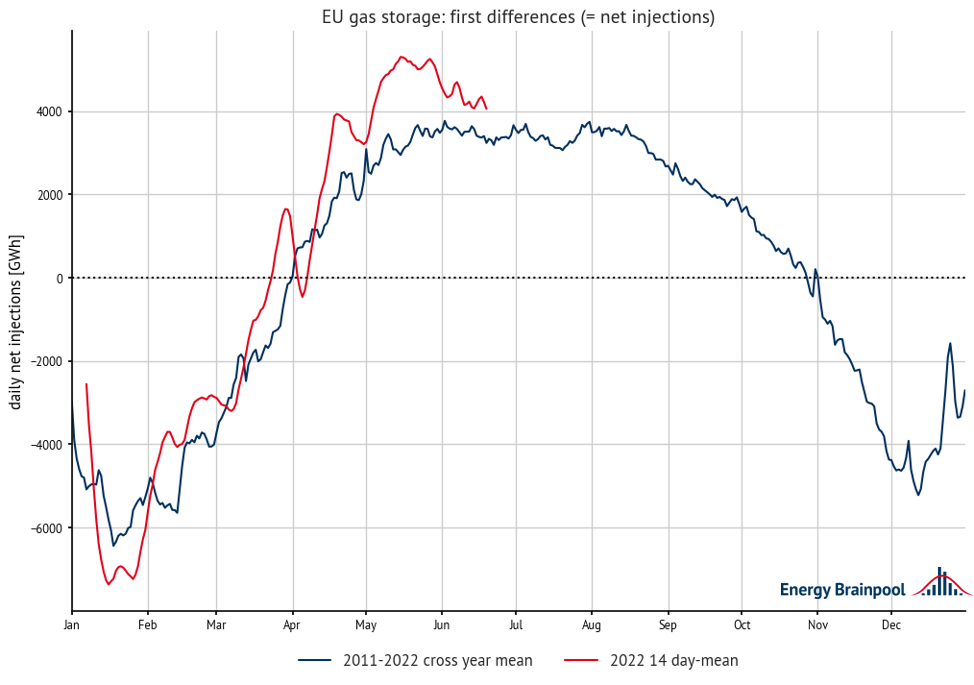
Figure 4: the EU gas net injection profile, source: own calculations, EIG.
Moreover, looking at the historical profile of net injections, it is reasonable to assume that they would not increase further even without the Freeport and Nord Stream 1 curtailments. This is because, as a rule, feed-in volumes peak from June to July and then remain largely stable. From mid-August, net feed-ins begin to decline as the summer ends with traditionally less intensive industrial production and the start of the heating season approaches.
Taking the second difference in daily storage levels in the historical average, i.e., the daily rate of change in net injections, and applying it to the baseline level of the current 14-day average injection; we obtain an estimate of net injections for the remainder of the year.
Base estimate plus three scenarios.
From this estimate, our “base case,” we can subtract the missing volumes on a daily basis. In total, we formulate three scenarios in addition to our base estimate.
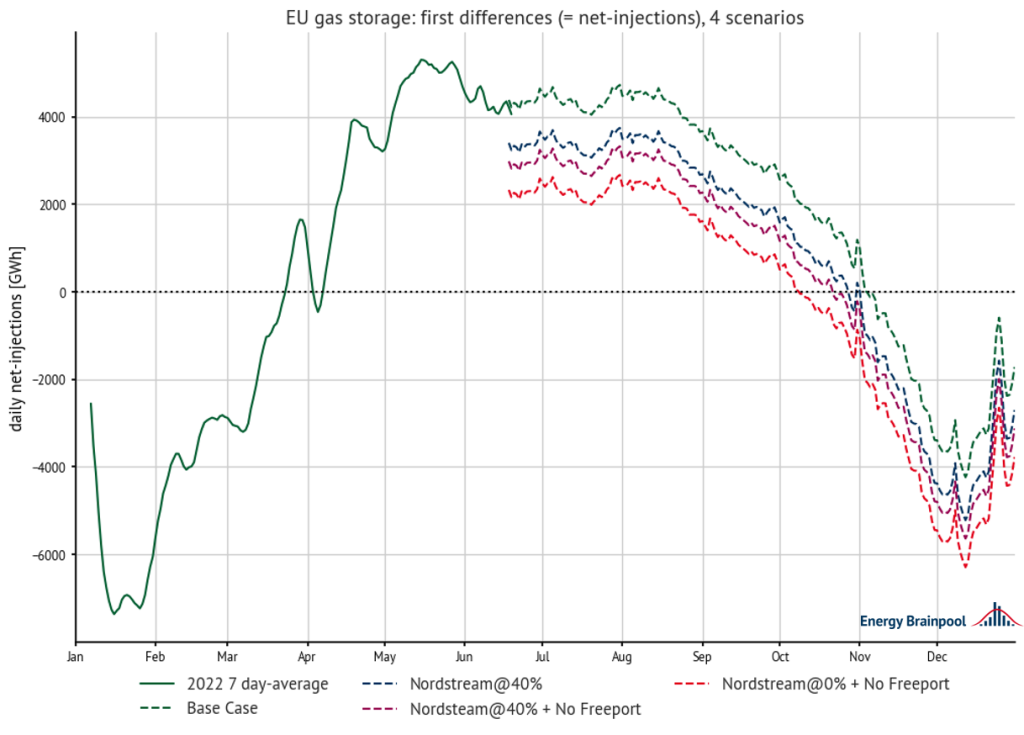
Figure 5: the EU gas net injection profile: 4 scenarios. Source: own calculations, EIG
- “Base Case”:
14-day injection level before import reduction, extrapolated with the annual average of the daily rate of change of net injections for the period 2011–2022. - “Nordstream@40 %”:
“Base Case”: 980 GWh/day. - “Nordstream@40 % + No Freeport”:
“Base Case”: (980 GWh/day + 420 GWh/day). - “Nordstream@0 % + No Freeport”:
“Base Case”: ((980 GWh/ day + 654 GWh/ day) + 420 GWh/ day).
Looking at the date when the net injection falls below 0 GWh/day for the first time, the difference between the scenarios becomes clear. In the “Base Case”, the net feed-in falls below 0 GWh/day for the first time on November 4. In the extreme case “Nordstream@0 % + No Freeport” this happens on October 9, in the status quo case “Nordstream@0 % + No Freeport” on October 22.
Resulting storage levels
Applying the daily net injections to the absolute storage level and dividing it by the total capacity, we obtain an estimate of the percentage fill level time series for all scenarios.

Figure 6: Europe’s gas storage levels in 2022: 4 scenarios, source: own calculations, EIG.
As expected, the “base case” scenario with unchanged flows would result in a storage level well above 90% by November 1. The loss of 980 GWh/day is clearly reflected in the results. The expected storage level compared to the “base case” drops by 12 percentage points 84 percent. Although this is still in line with the EU storage target of 80 percent by November 1.
However, when the loss of the Freeport export facility is added to the reduced volumes, the EU target is missed. In the Nordstream40 % + No Freeport scenario, the EU storage targets reach 78.77 percent by November 1, 2022, and generally show a very similar trajectory to the 2021 values. However, the situation would become increasingly difficult if Nord Stream 1 volumes were lost completely. As net injection falls below 0 GWh/day in early October 2022, the EU storage ratio drops to 70.62 % by November 1.
Sensitivity to weather years and other year-specific factors.
The current estimates were generated using the cross-year average of the 2011–2021 rate of change in daily net feeds. However, looking at the feed-in rates of the sample years individually, large differences in the pace of net feed-in as well as the start of the heating season and the peak of the levels can be seen. However, repeating the above calculation for each sample year individually yields the following results:
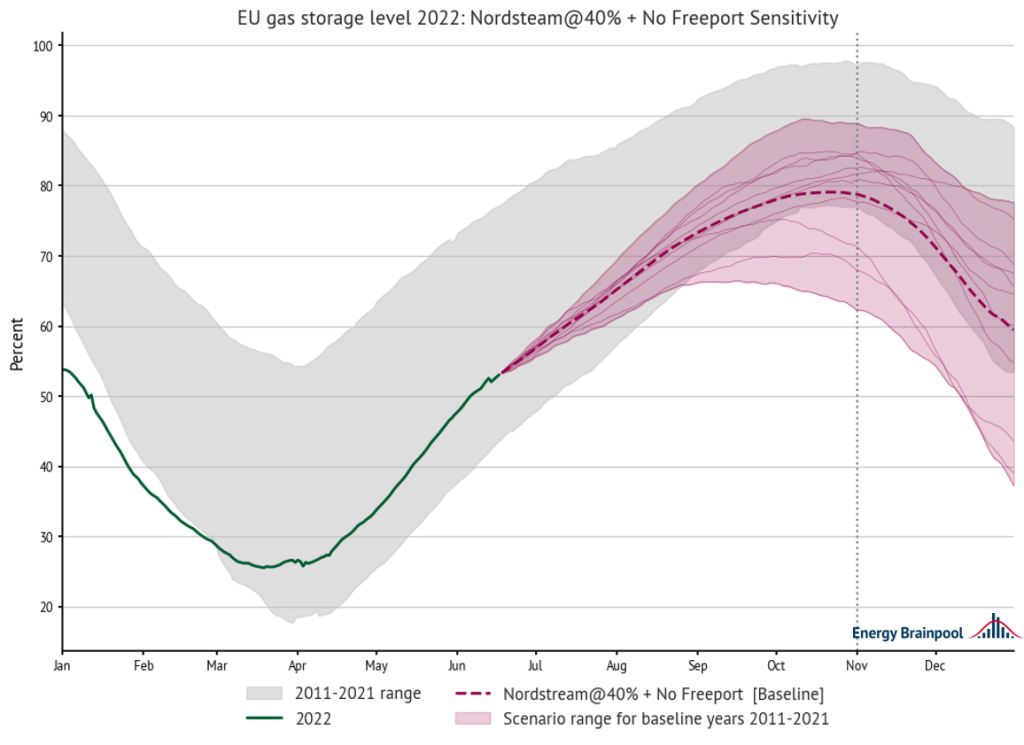
Figure 7: Baseline status-quo case, sensitivity to year-specific factors, source: own calculations, EIG.
Looking at the status quo case “Nordstream@40 % + No Freeport” with a storage level of 78 percent by November 1, 2022, it can be seen that the results vary, sometimes significantly, depending on the baseline year. In extreme cases, storage levels range from nearly 90 percent to 63 percent on November 1, 2022. However, these “extreme” estimates should be viewed with caution. This is because low feed-in rates can also be due, for example, to storage facilities that are already full in the middle of the year. The core of each base year varies between 71 % and 85 %, a range of +/- 7 %.
What will it take to still meet the EU storage targets?
We now turn back to the baseline status quo case of “Nordstream@40 % + No Freeport” that we are currently observing. From this, we can calculate how large the delta in daily injections needs to be to reach the target of 80 percent or more, and then assess the potential impact of gas conservation measures by November 1, 2022.
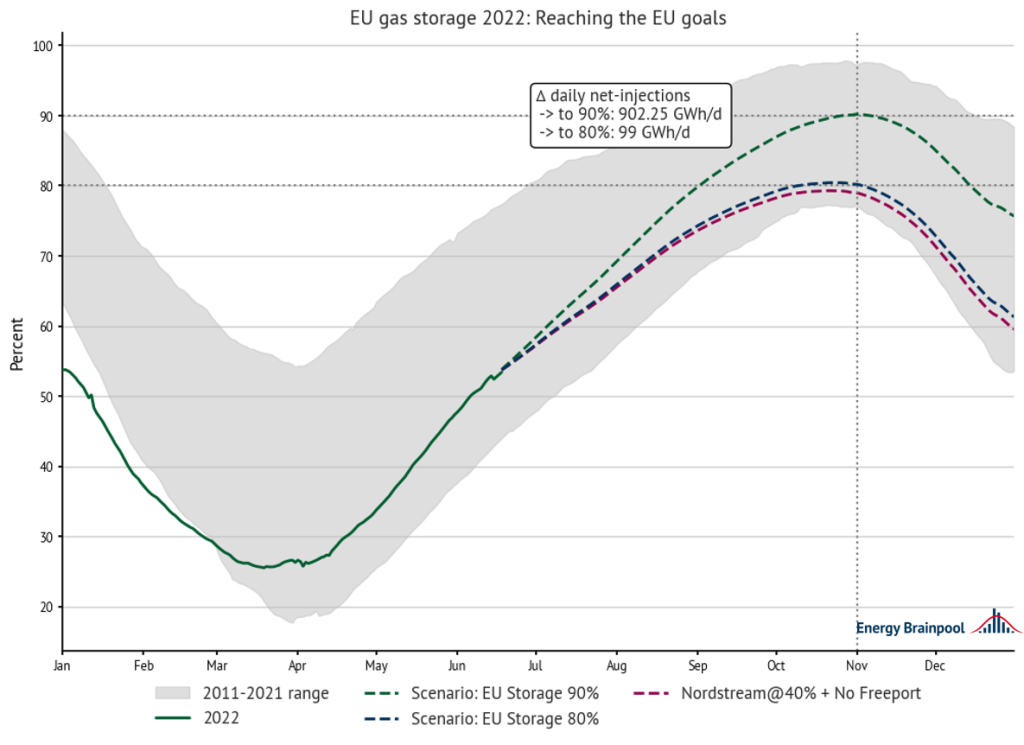
Figure 8: How can storage targets be met? Overcoming the deficit. Source: own calculations, EIG
Summary
It can be shown that from June 18 to November 1, 2022, EU countries will need to make up a deficit of 99 GWh/day of net injections to meet the 80 percent storage target. To reach the 90 percent target originally set by the EU, an additional 902.25 GWh would need to be injected daily.
To put these numbers in perspective: According to Eurostat, the European Union had a total final energy consumption of 10299 TWh of natural gas per year in 2020, or 28.21 TWh per day. This includes electricity from gas generation. 7.36 TWh/day was consumed by the industrial sector, 8.02 TWh/day by the transport sector, and 12.82 TWh/day by other sectors including households and services. It should be noted, however, that in the latter sector in particular, consumption is heavily skewed toward the winter months due to the heating season.
The sectors in which the necessary quantities are saved are now in the hands of the political decision-makers. Achieving the EU storage target of 80 percent still seems feasible, even with minor restrictions, should gas supplies from Russia remain at current levels. However, it should be noted that the expected storage volumes might still fluctuate significantly, especially due to the influence of the weather and the start of the heating season.


What do you say on this subject? Discuss with us!