The Climate Protection Emergency Programme was adopted at the end of June, although less ambitiously than expected in advance. Other topics in June 2021 are the results of the first wind tender since 2017 with more than 1000 MW awarded and the lower share of renewables in the first quarter of 2021. Moreover, prices on the futures market reach new highs.
On 23 June, the Federal Government’s “Climate Protection Emergency Programme 2022” was adopted. The reason for this programme was the new EU emission reduction targets and the new Climate Protection Act, which require increased measures. With this programme, the Federal Government is pursuing the goal of making Germany a pioneer in climate protection, for which funds of around 8 billion euros are now earmarked for financing (source: Federal Ministry of Finance).
Climate Protection Emergency Programme light
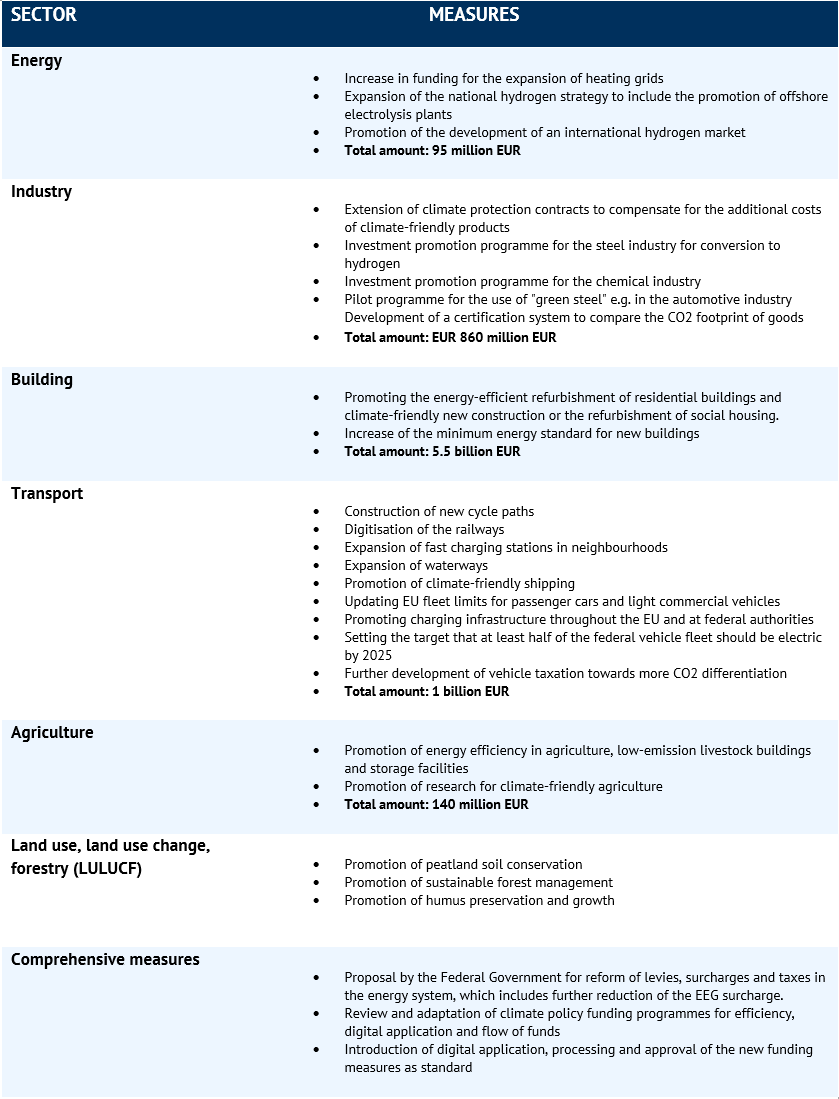
The Climate Protection Emergency Programme contains numerous of sectoral measures that include the energy, industry, buildings, transport, agriculture and land use sectors, as well as cross-sectoral measures. A summary of the measures adopted is shown in figure 1. However, the introduction of a nationwide photovoltaic obligation for new buildings and for major roof renovations, which was included in the draft of the programme, was not adopted.

Fig. 1: Measures of the “Climate Protection Emergency Programme 2022” by sector (source: Energy Brainpool).
Wind tender: more than 1000 MW awarded
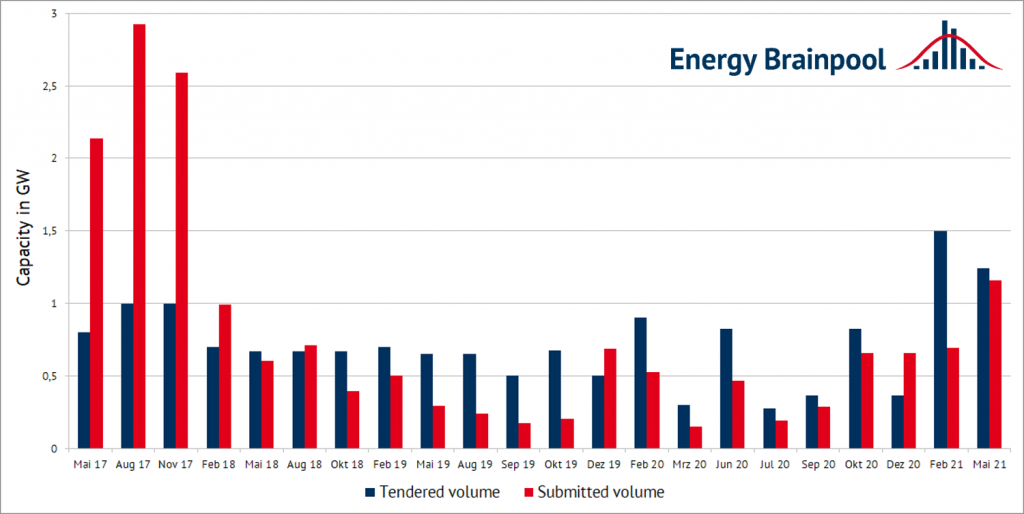
The results of the onshore wind tender of 1 May were published in June. For the tendered capacity of 1,243 MW, 127 bids for a total of 1,110 MW were accepted. The tender was thus signed with only 89.3 percent of the tendered quantity, and this despite the fact that the tendered quantity was most recently reduced from 1,500 MW to 1,243 MW due to the threat of undersubscription (source: Montel). For the last tender round in February for 1,500 MW, only bids for 718 MW were submitted. See also figure 2.

Fig. 2: Tender volumes and submitted volumes of onshore wind tenders since 2017 (source: Energy Brainpool).
For the first time since 2017, more than 1000 MW of capacity was awarded in May. The average, volume-weighted award value in this tender round was 5.91 ct/kWh, with the highest bid value being 6.00 ct/kWh and the lowest bid value being 5.68 ct/kWh (source: Bundesnetzagentur). The most awards were made to projects from Schleswig-Holstein (295 MW) and Lower Saxony (263 MW).
Despite the positive development in the quantities submitted, there was also another side to the coin in this tender round. Of the successful bids, 43 had already been awarded for the first time in February 2018. Since the projects were not constructed according to their deadline, the corresponding awards lapsed on 1 March this year. This fact is of course to the detriment of the previous wind power expansion – however, the investors of the projects that were able to participate again in the May tender can benefit financially from this (source: Montel).
Low share of renewables in Q1 2021
In the first quarter of 2021, renewables supplied a total of 21 percent less electricity than in the same quarter of the previous year, according to a report by AGEB. The main reason for this was the low generation from wind power.
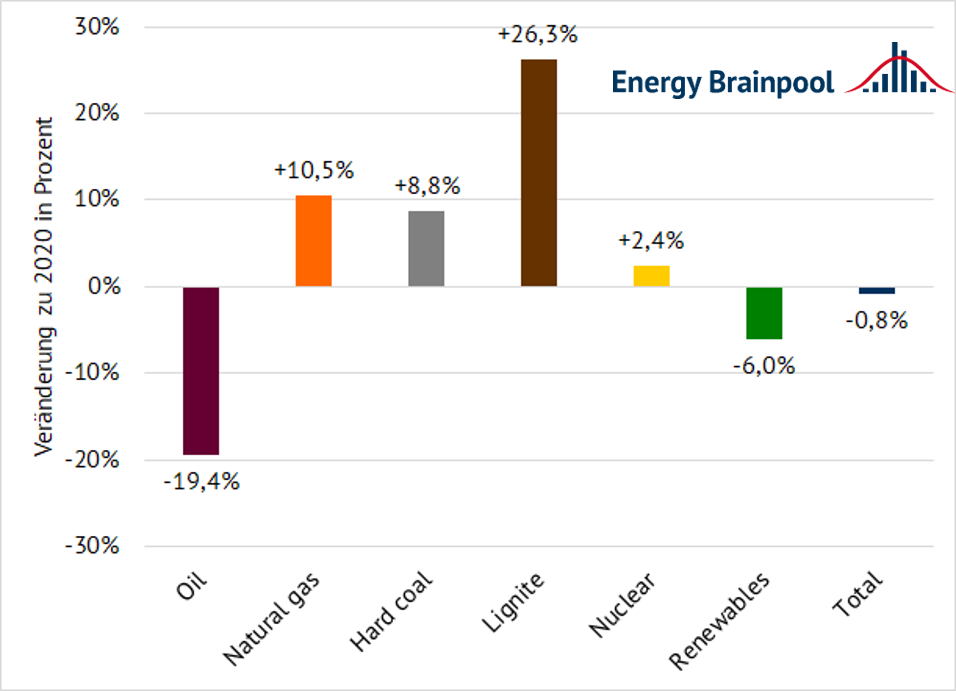
Compared to the same period last year, wind power generation was 35 percent lower (onshore) and 17 percent lower (offshore). Despite stable PV feed-in, this resulted in a significantly higher share of fossil energy sources in the energy supply compared to the same period in 2020. See also figure 3.

Fig. 3: Change in electricity generation in Q1 2021 compared to the same period of the previous year by energy source in per cent (data source: AGEB).
The use of lignite increased by 26.3 percent, the consumption of hard coal by 8.8 per cent. Natural gas also saw an increase of 10.5 per cent in the first quarter of 2021. In addition to the low feed-in of renewables, the above-average cold temperatures and the associated increase in demand for heat also played a role in the higher consumption of natural gas. Oil recorded a decline of 19.4 per cent in the first three months of the year. AGEB cites the restricted air traffic caused by the Corona pandemic in particular as the reason for this. The increased use of fossil fuels caused the CO2 emissions of the energy sector to rise (source: pv-magazine).
PV supplied a similar amount of electricity as in 2020, so that the 6.0 per cent decline in renewable feed-in is entirely due to the decline in wind energy.
Overall, primary energy consumption in the first quarter of 2021 fell by 0.8 per cent compared to the previous year. The main reason for this was Germany’s 3.4 per cent drop in economic output due to the Corona pandemic and higher energy costs due to rising CO2 prices (source: pv-magazine).
New records on the futures market
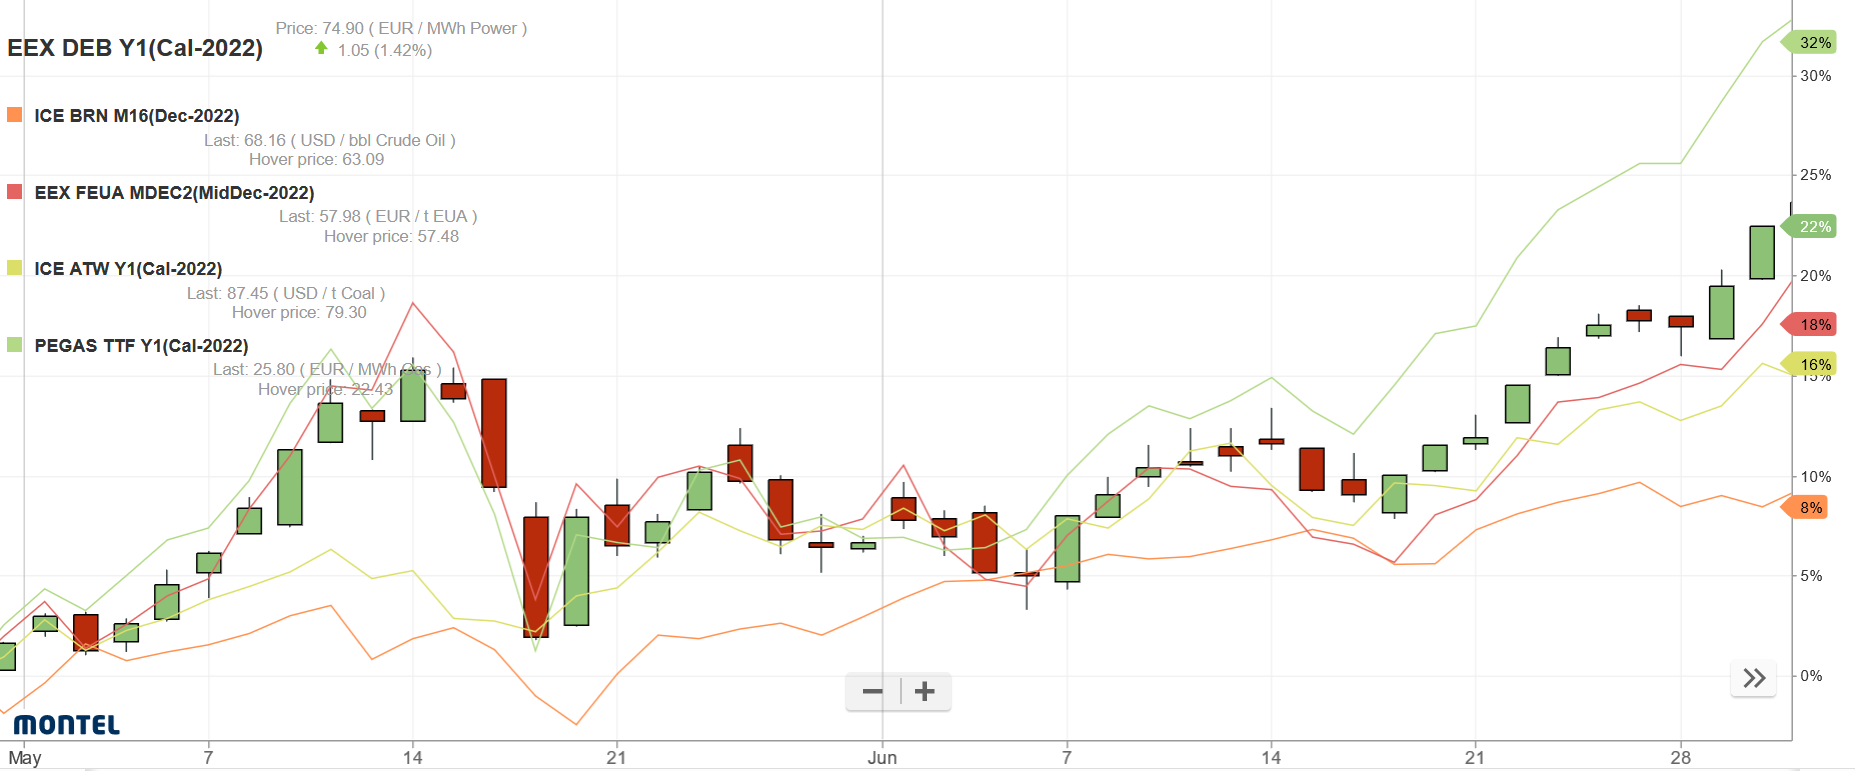
In June, there were bullish signals for all commodities, which drove electricity prices significantly upwards. On 29 June, the electricity front for Germany thus even reached its 13-year high of 71.2 EUR/MWh. The price increase was primarily due to rising CO2-prices, which once again approached 56 EUR/t at the end of the month (source: Montel). The percentage price development of the commodities can be seen in figure 4.

Fig. 4: Percentage price development of the German electricity front year (candle sticks), CO2 allowances with delivery in December 2021 (red line), Brent oil with delivery in December 2021 (orange line), gas front year on the TTF (green line) and coal front year (yellow line) from the beginning of May to the end of June 2021 (source: Montel).
Front year gas also rose significantly during the month, showing a 32 percent increase at the end of the month (source: Montel) compared to the beginning of May. Gas was thus also a price driver on the energy market in June. The reason for this: high demand as well as low storage levels due to the cold temperatures in the past months (source: Montel).
Coal also reached record highs again. The front month showed a 10-year high of 122 USD/t at the end of June, driven by hot temperatures in Asia and the associated need for cooling, as well as low inventories (source: Montel).
Lots of sun and little wind on the spot market
The share of renewables in electricity generation was 48.3 percent in June, somewhat lower than in May. Although solar feed-in at 20.6 percent of electricity generation set a record for the month of June due to a high number of sunshine hours, generation from wind was comparatively low. With only 4.48 TWh, the feed-in from wind was almost 2 TWh lower than during June 2020, resulting in the low share of renewables (source: EnergyCharts). Figure 5 shows the electricity generation and consumption in June 2021.
Visit our current live online trainings for more in-depth energy market knowledge!!


What do you say on this subject? Discuss with us!