Although the economy suffered a slump in the first few months of last year, electricity consumption rose by almost 300 TWh over the year 2020 as a whole. The shares of renewable energies in electricity generation increased. Especially in the last quarter of 2020, more PV and wind capacity was added than is installed in Germany up to now.
China’s energy transition has continued to evolve in 2020. The share of thermal generation, which consists of over 90 per cent coal-fired power plants, is still below 70 per cent, as it was in 2019 (source: China Energy Portal). This is shown in figure 1.
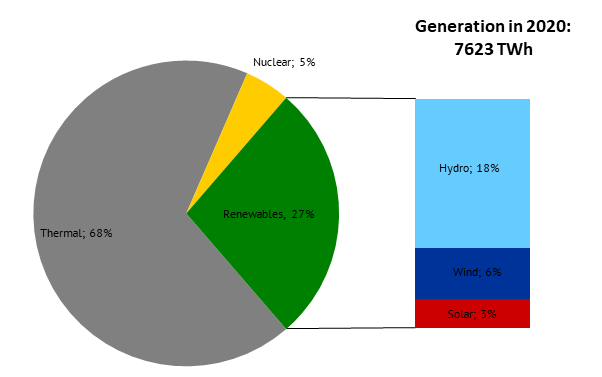
Figure 1: shares of different generation technologies in the Chinese electricity mix in 2020 (source: Energy Brainpool)
The Chinese power plant portfolio generated 7623 TWh last year. This corresponds to more than twice as much electricity as all European countries combined. Despite the Corona pandemic and the associated economic influences, total generation in China increased by 298 TWh compared to 2019. This increase alone is equivalent to more than 60 per cent of Germany’s total electricity generation in 2020.
Share of renewables increases in the Corona year
Of this additional electricity demand of 300 TWh, 129 TWh was covered by thermal power plants. In comparison, renewables, including hydropower, recorded an increase of 151 TWh. The remaining increase (17.5 TWh) was supplied by new nuclear power plants. Figure 2 shows this year-to-year change in generation from different technologies between 2019 and 2020.
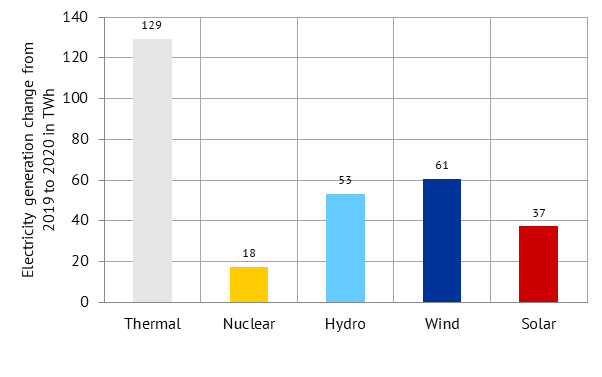
Figure 2: change in electricity generation of different technologies compared to the previous year in TWh (source: Energy Brainpool)
When we look at the percentage increase (shown in Figure 3), it can be seen that electricity generation in thermal power plants increased less in per centage terms. This is related to the high level of capacity already installed before 2020.
New electricity generation from wind and solar power is much larger in percentage terms, as there has been less installed capacity here in China to date. Generation from nuclear power increased at a lower rate of 5 per cent compared with the previous year (2019: 20 per cent).

Figure 3: percentage change in electricity generation of different technologies compared to the previous year (source: Energy Brainpool)
Renewable capacities show record growth
The increased generation from renewable energies in China 2020 is also reflected in the newly installed capacities. Renewable energy capacities in 2020 increased more than ever before.
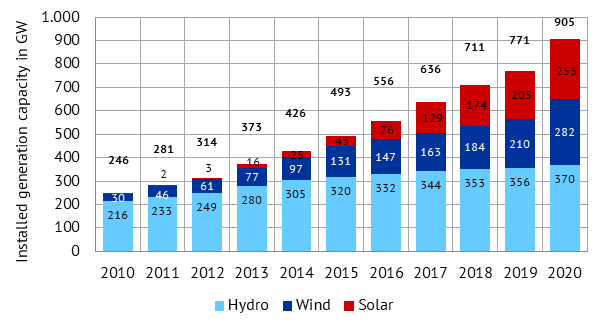
While hydropower capacity increased by only 14 GW, solar installations recorded an increase of about 50 GW; installed wind power capacity even increased by 72 GW. In comparison: In Germany, the total installed capacity of PV systems in 2020 corresponded to 54 GW and of wind power to 63 GW. This means that the addition of Chinese PV capacity alone is equivalent to Germany’s total installed capacity. In the case of wind power, the Chinese addition even exceeds this figure.
China was thus responsible for nearly 50 per cent of global renewable capacity additions in 2020. The installed generation capacities of renewables are shown in Figure 4.
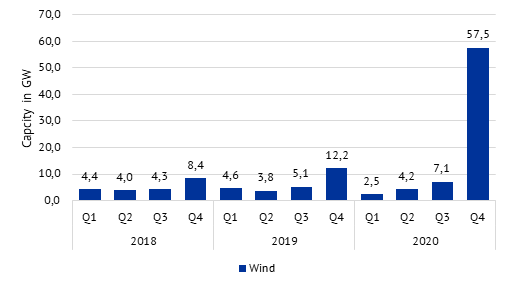
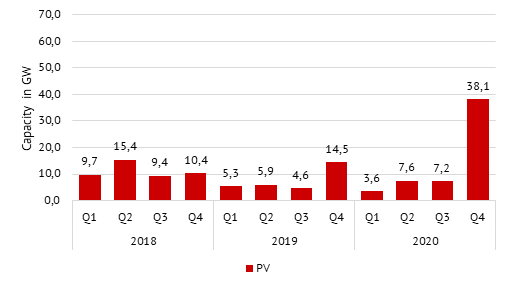
The largest share of renewable capacity additions in China occurred in the last quarter of 2020. With a total of 92 GW of newly installed capacity, China added more than three times the amount of renewables in the fourth quarter of 2020 than in the same quarter of the previous year (source: npr). Wind power in particular experienced a particularly strong increase in capacity. This development is shown in figure 5.
With 57.5 GW of new wind capacity in Q4 2020, the addition almost quintupled compared to the same quarter of the previous year. This significant increase in the last quarter of the year is related in particular to an announcement from Beijing to discontinue subsidies for new onshore wind power projects in China from 2021. The discontinuation of subsidies in the new year provided strong incentives for plant operators to still complete the plants by the end of the year.
However, solar capacity additions in the final quarter of 2020 were also more than twice as high as in the same quarter last year, at 38.1 GW. The addition of PV systems by quarter is shown in Figure 6.
E-mobility grew more slowly in 2020
The company Canalys recently published the sales figures for electric vehicles in China for 2020, according to which 1.3 million electric vehicles were sold in China last year. Although this value represents a new record, with annual growth of only 8 per cent, this is little in a global comparison. Global electric vehicle sales grew by a full 39 per cent in 2020. The low growth is related in part to China’s e-vehicle policies.
Due to several policy changes and consumer subsidies, the market had been disrupted the last. As a result, automakers have had difficulty boosting the market, even though the Chinese government generally supports the transition to e-vehicles (source: businesswire).
China’s national emissions trading system starts in 2021
At the provincial level, experiments with CO2-emissions markets had already been underway since 2015. In 2017, the process of building a national emissions trading system from the experiences in the provincial systems began. In February 2021, the time had finally come: the Chinese national emissions trading system was officially launched. Trading is scheduled to begin in July 2021 (source: HFW).
The first phase, however, covers only the power sector and thus about 30-40 per cent of the country’s CO2emissions and over 2200 companies. Initially, about 70 per cent of the required pollution allowances for 2019 and 2020 will be issued free of charge to participating plants.
Gradually, however, the allocation of allowances will be managed through auctions. Down the road, it is also conceivable that industrial sectors and domestic aviation will be covered by emissions trading.
Expected trading prices are below the current prices of the European emissions trading system, with estimates ranging from USD 4-6/ton. With increased climate change ambitions, what is now the world’s largest emissions trading system (4 Gt) could generate revenues of up to USD 25 billion in 2030 (source: HFW, Euractive).
Strong demand met by coal in the first quarter of 2021
In the first quarter of 2021, Chinese electricity demand increased sharply compared to previous years. With 1,895 TWh, national power generation is about 19 per cent higher compared to the first quarter of 2020.
This was due to the improved economic situation, as well as the coldest winter months in decades. The growth in electricity generation in Q1 2021 compared to the same quarter last year by technology can be seen in Figure 7.
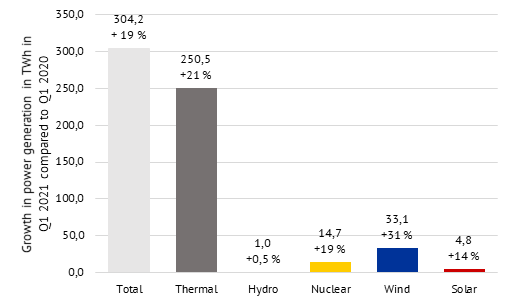
Figure 7: growth in power generation in Q1 2021 compared to Q1 2020 by technology, in per cent and in TWh (source: chinaenergyportal)
Although China expanded its wind and solar capacity at a record rate in 2020, growth in electricity demand in Q1 2021 primarily meant growth in thermal generation. Thus, about 82 per cent (251 TWh out of 304 TWh) of the 19 per cent increase in electricity demand was met by thermal generation. This in turn consisted of about 90 per cent coal-fired generation.
Of the remaining additional electricity generation, only 13 per cent came from renewables, 11 per cent of which came from wind power alone.
Energy targets in the 14th Five-Year Plan
One of the most significant recurring political events in China is the announcement of the Five-Year-Plan, the key planning and target document for the country’s economic and political development over the next five years. On March 11, 2021, the Chinese government approved the 14th Five-Year-Plan (2021-2025) and long-term goals through 2035.
The energy targets call for an 18 per cent reduction in CO2-intensity and a 13.5 per cent reduction in energy intensity. Furthermore, a CO2-emission cap is mentioned for the first time, but no official limit has been set yet (source: CarbonBrief).
In the elaboration of the Ministry of Energy (NEA) on the 14th Five-Year Renewable Energy Plan, further concrete figures were given. For example, the combined installed capacity of wind and PV is expected to reach 1200 GW by 2030.
In terms of installed capacity of wind and PV by the end of 2020, over 66 GW of new capacity would need to be installed annually until 2030. The share of wind and solar power is expected to increase from 9 per cent in 2020 to 11 per cent this year and finally to 16.5 per cent in 2025 (source: NEA).
China has higher CO2-emissions than the OECD countries combined since 2019 (source: Reuters). Accordingly, changes in China’s energy system toward the target of carbon neutrality in 2060 are one of the most important levers for achieving global climate goals.



What do you say on this subject? Discuss with us!