


State Grid forecasts 3.5 percent rise in national electricity consumption for 2016 to 5770 TWh compared to last year. Regionally unbalanced capacity additions are likely, while wind lags behind.
")
Sources and further information with kind recommendations of Azure International.
Following on the data on PV installations for the first half-year of 2016, new data on China’s electricity consumption and installation of new power generating capacity have been revealed. While the country’s electricity consumption rose to 2780 TWH or by 2.7 percent over the consumption in 2015 by July 2016, the largest Chinese grid operator, State Grid Corporation of China estimates that total electricity consumption will rise by 3.5 percent or 5770 TWh over the entire year.
In addition, the numbers for capacity to be installed for various power sources in 2016 show a regionally divided picture. Figure 1 depicts the planned growth of new capacity according to different regional grids.
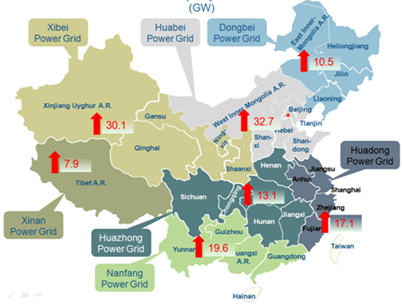
Figure 1: Regional distribution of planned capacity additions in 2016 in GW (source: SGCC, Azure International)
With planned power generating capacity additions of more than 30 GW in each of the northern regions Huabei and Xibei, 25 and 23 percent of the entire capacity additions of 131 GW in 2016 should take place in those remote areas with little consumption. Those regions have already been prone to curtailment of wind and solar energy and low operational hours for conventional power plants. Unless, power transport capacity to the load centers of the east coast, the growth in capacity will only exacerbate those problems. The other regional grids should accommodate the following proportion of the capacity additions:
- Nanfang (15%)
- Huadong (13%)
- Huazhong (10%)
- Dongbei (8%)
- Xinan (6%)
Capacity that has already been added during the first half-year of 2016 compared to planned capacity additions in 2016 is shown in figure 2.
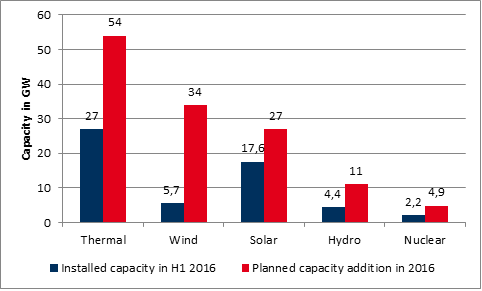
Figure 2: Capacity addition during H1 2016 vs. planned capacity addition in 2016 (source: Energy Brainpool)
From these figures it is very clear that most of the planned capacity additions of China’s power sector in 2016 are planned to come from thermal, primarily coal-fired power plants. Half of the thermal capacity has already been added, while wind power lags behind the goals considerably. Solar power installations have however been quite high during the first six months of 2016. The lowest increase in installed capacity is to originate from nuclear.