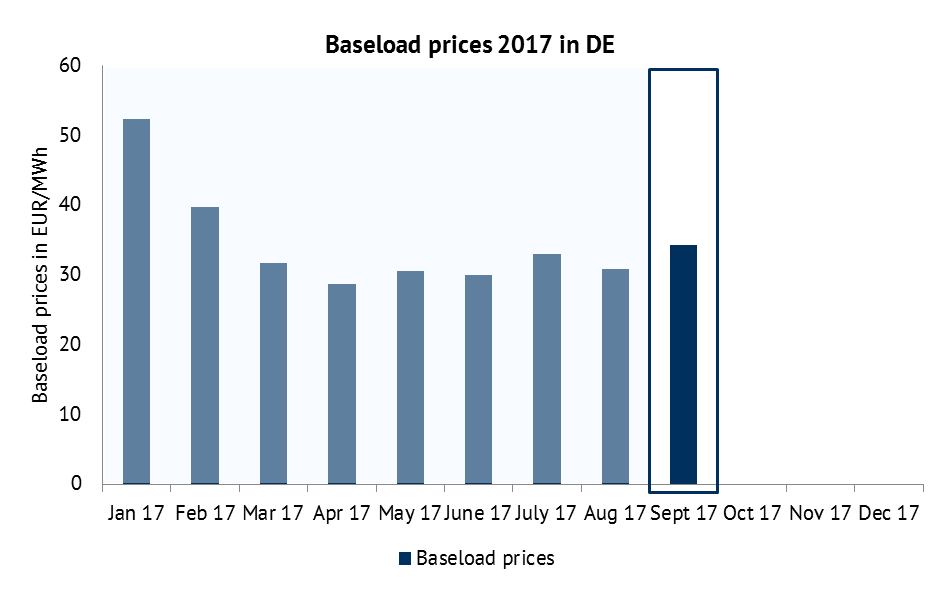
The “gloomy” September 2017 lead to a decline in solar production of around 33 percent compared to the previous month. Baseload prices are rising, due to the decline in production from variable renewable energy sources (vRES).
Development of sales values in 2017
The sales values represent the weighted average vRES market revenue. In the white paper “Valuation of revenues of fluctuating renewable energy sources”, the key performance indicators of the revenues of non-promoted vRES are explicitly defined.
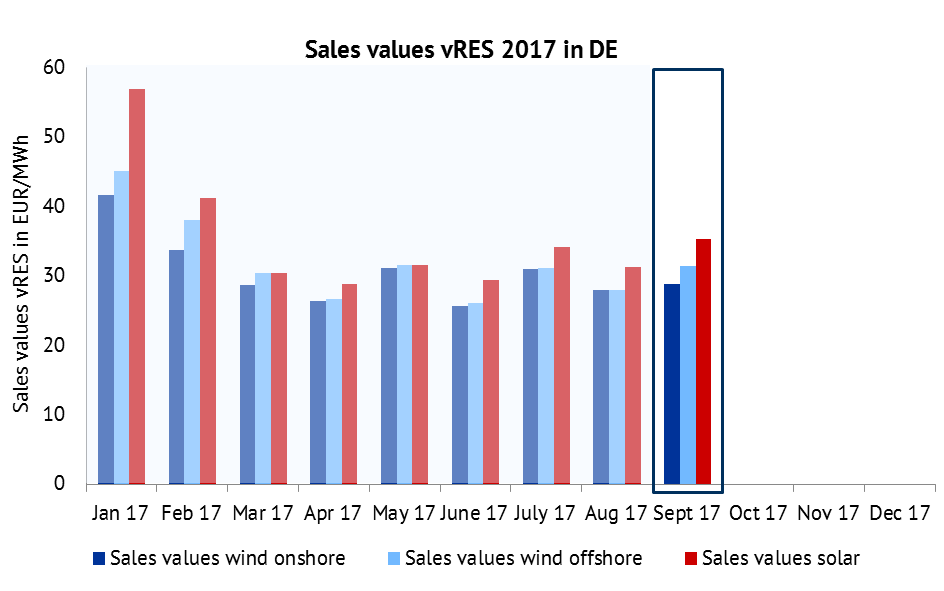
Figure 1: Sales values for wind onshore, wind offshore, PV in EUR/MWh. Source: Energy Brainpool, EPEX Spot, ENTSO-E Transparency
The sales values of vRES in September 2017 recovered from the downward trend from the previous month. Solar and offshore wind power plants earned an averaged 4 EUR/MWh more on the power exchanges than in the last month. In comparison, the average sales value of onshore wind turbines rose by just under 1 EUR/MWh. This is due in particular to the higher cannibalization effect of onshore plants. This means that the high simultaneity of the feed in combined with a high installed power capacity leads to lower achievable prices. Sales values for solar power plants are usually higher than for wind power plants. Reason for this is that PV feeds in at times of high electricity demand (by day); in contrast wind generation often takes place at times with low electricity demand.
Development of power generation from vRES
The power generation from vRES shows the total production of the respective month in gigawatt hours. In September 2017, solar power plants generated about 33 per cent less electricity than in the previous month. The production of offshore plants also fell by 10 per cent. Only onshore wind turbines posted a plus of 20 per cent in output compared to August.
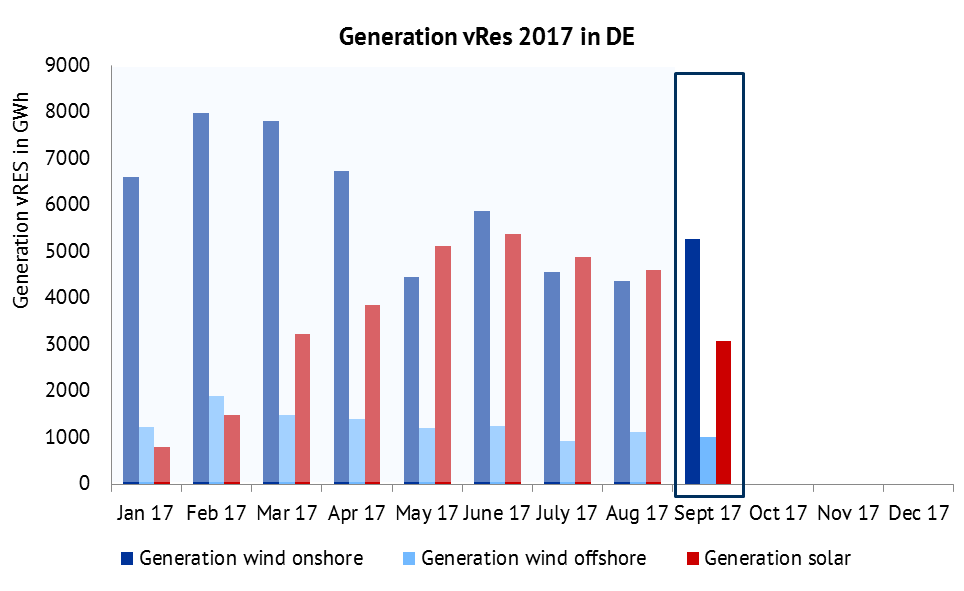
Figure 2: Electricity generation of wind onshore, wind offshore, PV in GWh. Source: Energy Brainpool, ENTSO-E Transparency
In September 2017, about three per cent of the total generation volumes (solar, wind-onshore and wind-offshore) were sold at negative prices.
Development of sales revenues in 2017
The sales revenues describe the technology-specific revenues of all onshore-wind, offshore-wind and solar plants in Germany at the power exchanges. The index is calculated from the product of the sales values and the generation at positive prices (sales volumes).
As a result of the sharp drop in the generation from solar plants (see Figure 2), total revenues of solar plants in the month of September declined by 22 per cent compared to the previous month (see Figure 3) despite higher average revenues (see Figure 1). On the other side, onshore wind turbines generated a total of around EUR 27 million more than in the previous month. Revenues for offshore wind power plants remained at a constant level.

Figure 3: Development of sales revenues of vRES in mln. EUR in 2017. Source: Energy Brainpool, ENTSO-E Transparency, EPEX Spot
Development of baseload prices in 2017
The strong temperature decline in September 2017 and the shorter days lead historically to an increased demand for electricity and thus to higher electricity prices. Due to the low-cost supply of electricity from vRES (merit order effect), the decline in the production of vRES of around 7 per cent compared to the previous month also leads to rising electricity prices. Electricity prices in September thus rose to an average of around 33.3 EUR/MWh, an average of 3.5 EUR/MWh or 11 per cent higher than in August 2017.
Development of vRES sales VALUEs IN DE, DK, FI, FR, IT, NO, SE and UK
Other European countries followed a similar path of development with regard to sales values of solar and wind onshore power plants in Germany, although at varying levels. The main reason for these differences is the generally varied price level due to differing demand patterns, generation structures and fossil fuel prices. Italy, Spain and the UK have the highest sales values amongst the listed countries. This is due to the strong dependence of electricity generation on gas-fired power stations, which are among the more cost-intensive power stations. In Scandinavia, however, inexpensive hydro power and nuclear power plants in particular determine electricity prices which lead to significantly lower sales values.
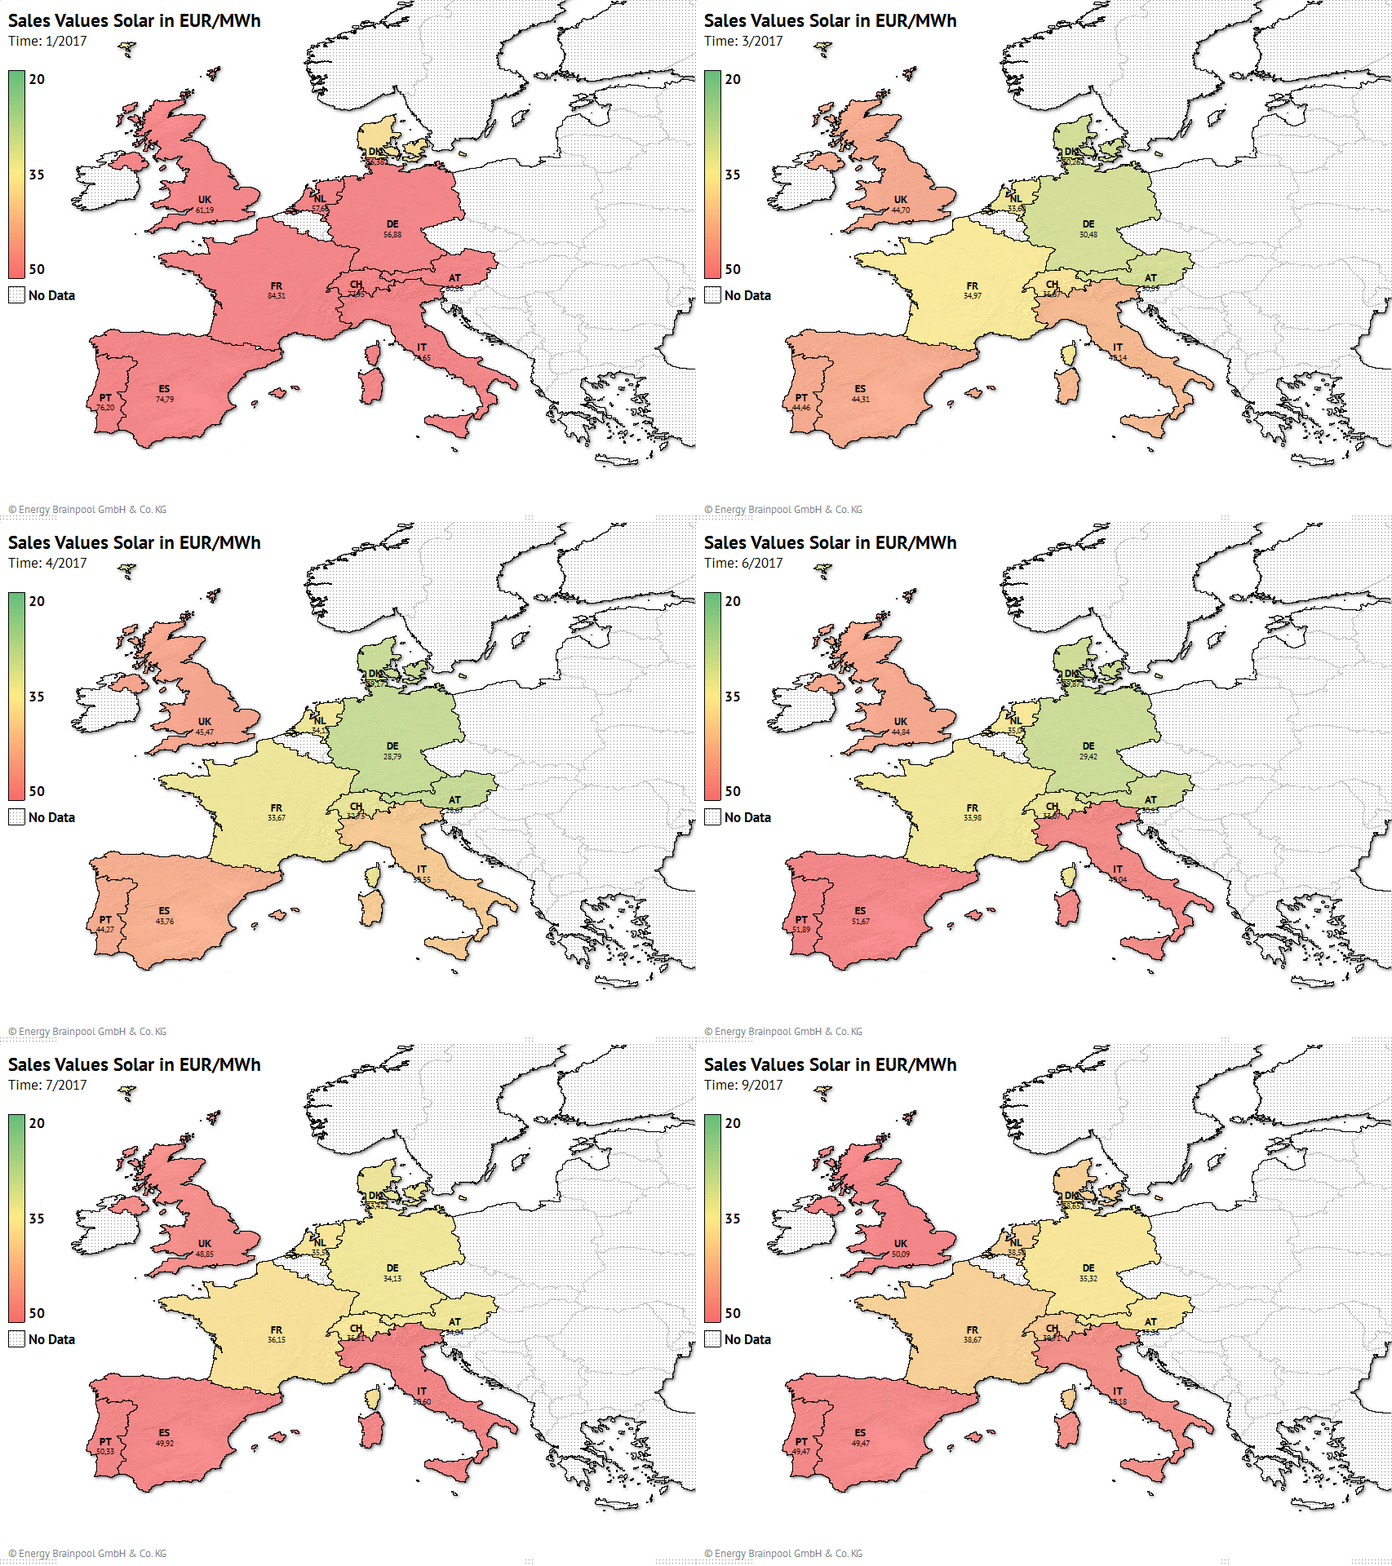
Figure 5: Development of solar sales values in EUR/MWh in GER, FR, ES, IT and UK. Source: EPEX Spot, N2EX (Nordpool), GME, Omie, Nordpool, ENTSO-E Transparency, Calculation and presentation: Energy Brainpool
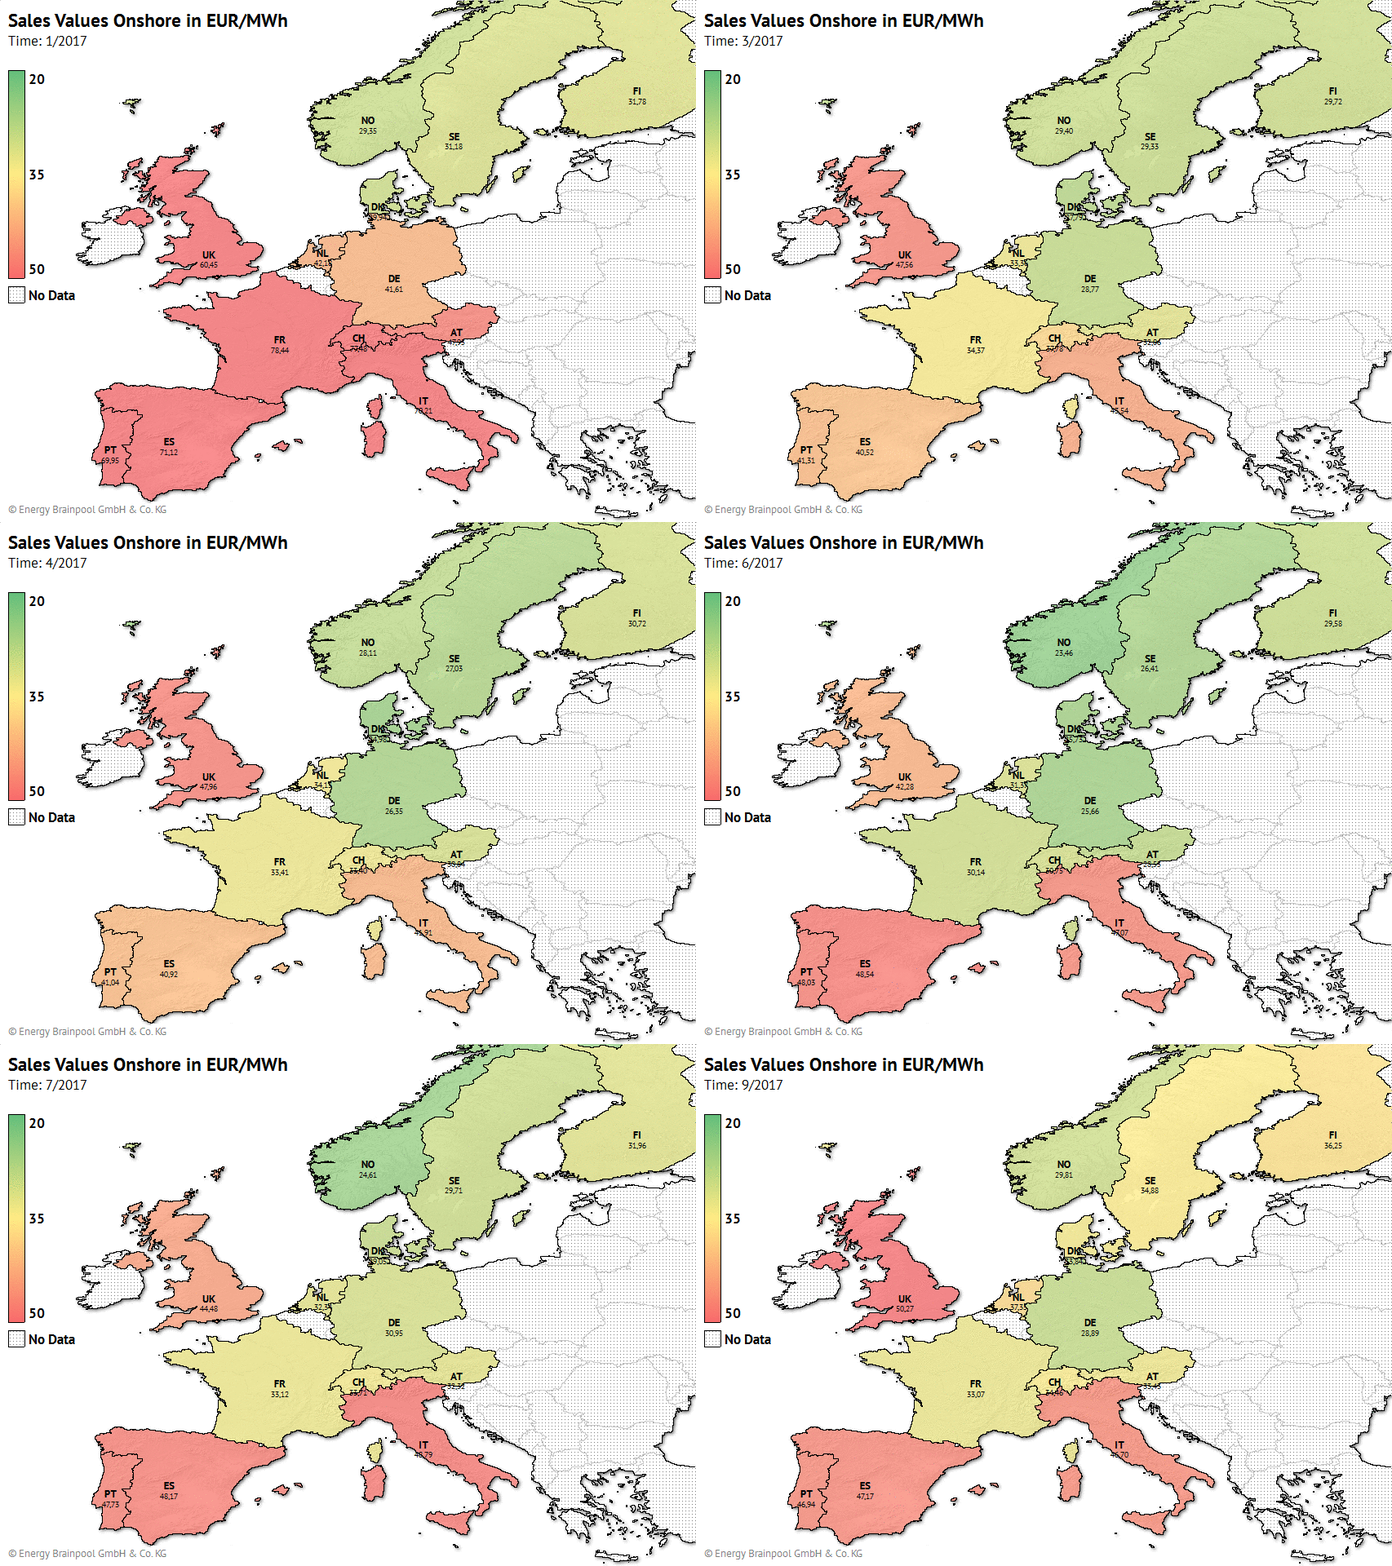
Figure 6: Development of wind onshore sales values in EUR/MWh in GER, FR, ES, IT and UK. Source: EPEX Spot, N2EX (Nordpool), GME, Omie, Nordpool, ENTSO-E Transparency, Calculation and presentation: Energy Brainpool
To the blog post ex post analysis August 2017


